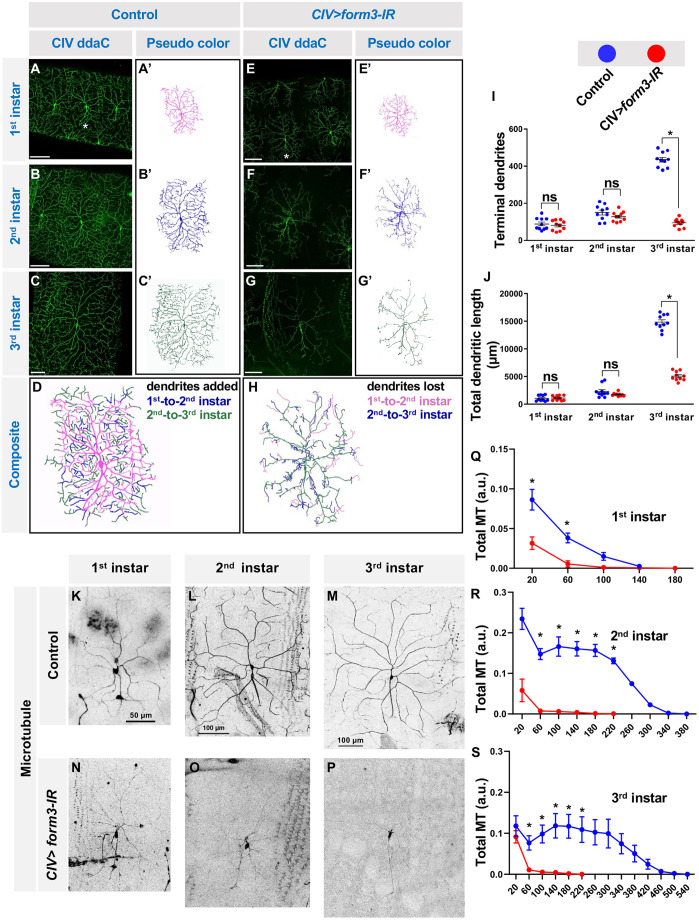
Fig. 3.
form3 is required for dendritic arbor maintenance. (A-H) Representative larval developmental time course images of the same CIV neuron taken of control (A-C) and form3-IR (E-G) at first, second and third instar larval stages, respectively. (A′-C′,E′-G′) Pseudo-colored panels showing the same neuron color coded for its developmental stages (magenta as first, blue as second, and green as third instar). (D) Composite image showing the arborization of dendritic branches that occurred from first to second to third instar stages, where blue marks those dendrites added from first to second instar, and green marks those dendrites that were added from second to third instar. (H) Composite image showing the loss of dendritic branches that occurred from first to second to third instar stages, where magenta marks those dendrites that were lost from first to second instar, and blue marks those dendrites lost from second to third instar. Note that in panels D and H the branches are not exactly to scale. Scale bars: 100 μm. (I,J) Quantitative analyses of the number of terminal branches (I) and total dendritic length (J) of control (n=10) and form3-IR (n=10) CIV neurons at different stages of development as indicated on the figure. Error bars represent mean±s.e.m. (K-P) CIV-GAL4-driven expression of UAS-mCherry::Jupiter in control (n=9) (K-M) or form3-IR (n=8) (N-P) at different stages of development, as indicated. (Q-S) Relative distribution of MTs as a function of path distance from soma. MTs beyond 220 μm from the soma were not detected in form3-IR (R,S). Values are mean±s.e.m. Statistical tests performed: (I,J) unpaired t-test, (I3rd-instar) *P=0.0001, (J3rd-instar) *P=0.0001; (Q-S) two-way ANOVA with Bonferroni correction, *P<0.05. See also Fig. S3. a.u., arbitrary units; ns, not significant (P>0.05).

