
Figure 4.
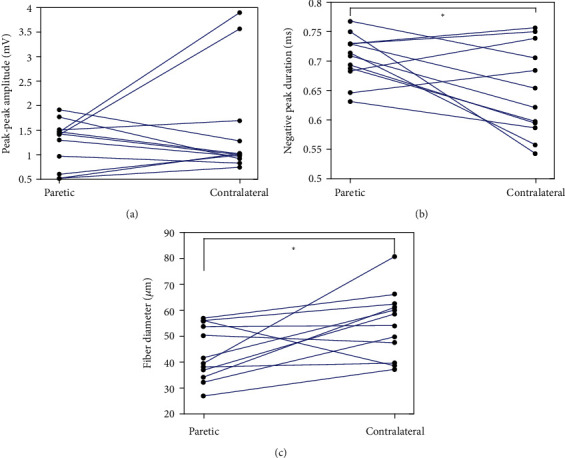
A comparison of (a) SFAP amplitude, (b) SFAP negative peak duration, and (c) estimated fiber diameter between paretic and contralateral muscles of the tested stroke subjects.
Official websites use .gov
A
.gov website belongs to an official
government organization in the United States.
Secure .gov websites use HTTPS
A lock (
) or https:// means you've safely
connected to the .gov website. Share sensitive
information only on official, secure websites.
A comparison of (a) SFAP amplitude, (b) SFAP negative peak duration, and (c) estimated fiber diameter between paretic and contralateral muscles of the tested stroke subjects.