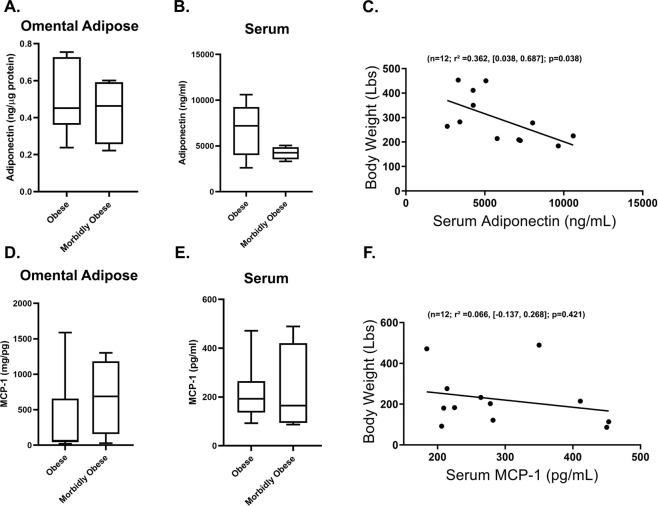
Fig. 1. Circulating adiponectin but not MCP-1 correlate with body weight.
A Omental adipose and (B) serum adiponectin levels in Ob vs. MOb subjects. C Regression plot depicting the association between body weight and serum adiponectin levels. D Omental adipose and (E) serum MCP-1 levels in Ob vs. MOb subjects. F Regression plot depicting the association between body weight and serum MCP-1. Box-and-whiskers plots illustrate within group minimum and maximum values range. For regression graphs, statistical significance and strength of association are indicated by p and r2 values respectively, 95% confidence interval in brackets, “n” indicates sample size.

