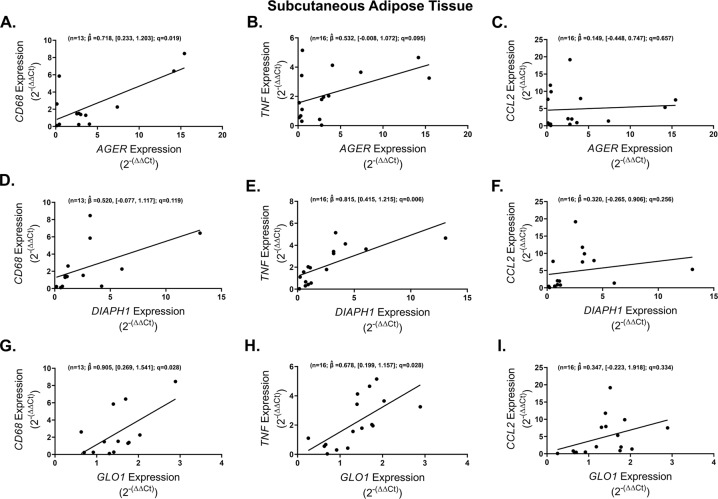
Fig. 3. Expression of obese subcutaneous adipose tissue AGE/RAGE/DIAPH1 axis genes positively correlates with prototypical inflammatory markers.
Regression plots depicting the association in subcutaneous adipose tissue between CD68, TNF and CCL2 with (A–C) AGER, (D–F) DIAPH1 and (G–I) GLO1 respectively. Statistical significance and strength of association are indicated by q and values respectively, 95% confidence interval in brackets, “n” indicates sample size.

