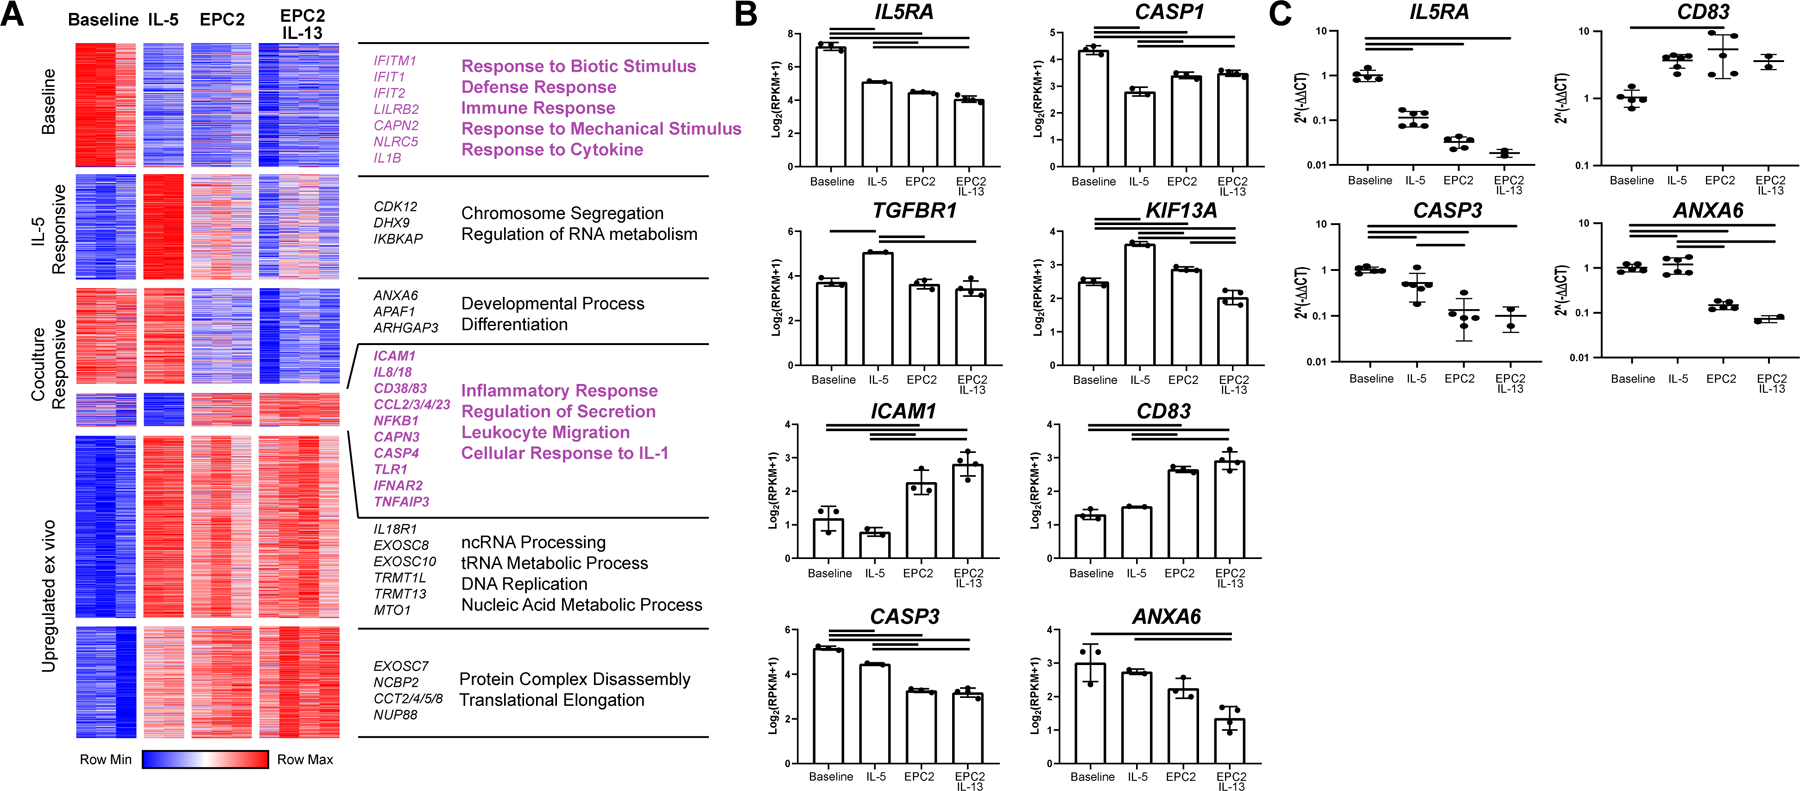
Figure 5. Tissue-specific responses of eosinophil gene expression to epithelial coculture.

RNA extracted from freshly isolated eosinophils or non-adherent, CD45-enriched cells after 7 days of culture in media alone (baseline) or with IL-5 (IL-5) or cocultured with EPC2s (EPC2) or EPC2s with IL-13 (EPC2 IL-13) was sequenced. In the dataset, 6591 genes were expressed. (A) Of these, 3652 genes identified as significant by ANOVA (FDR < 0.05) and were clustered via K means (K = 6). Clusters were entered into GOrilla to obtain enrichments using total expressed genes as background. Selected processes and representative genes are annotated. (B) Representative individual genes are plotted. Data represent a single biological replicate with 2–4 technical replicates per condition. (C) Selected genes were quantified by RT-PCR using RNA from 2–5 technical replicates and 3 biological replicates. Significant differences were assessed with one-way ANOVA and Tukey post-test. Bars indicate p < 0.01. Data shown in B-C are mean ± SD, and individual symbols represent technical replicates.
