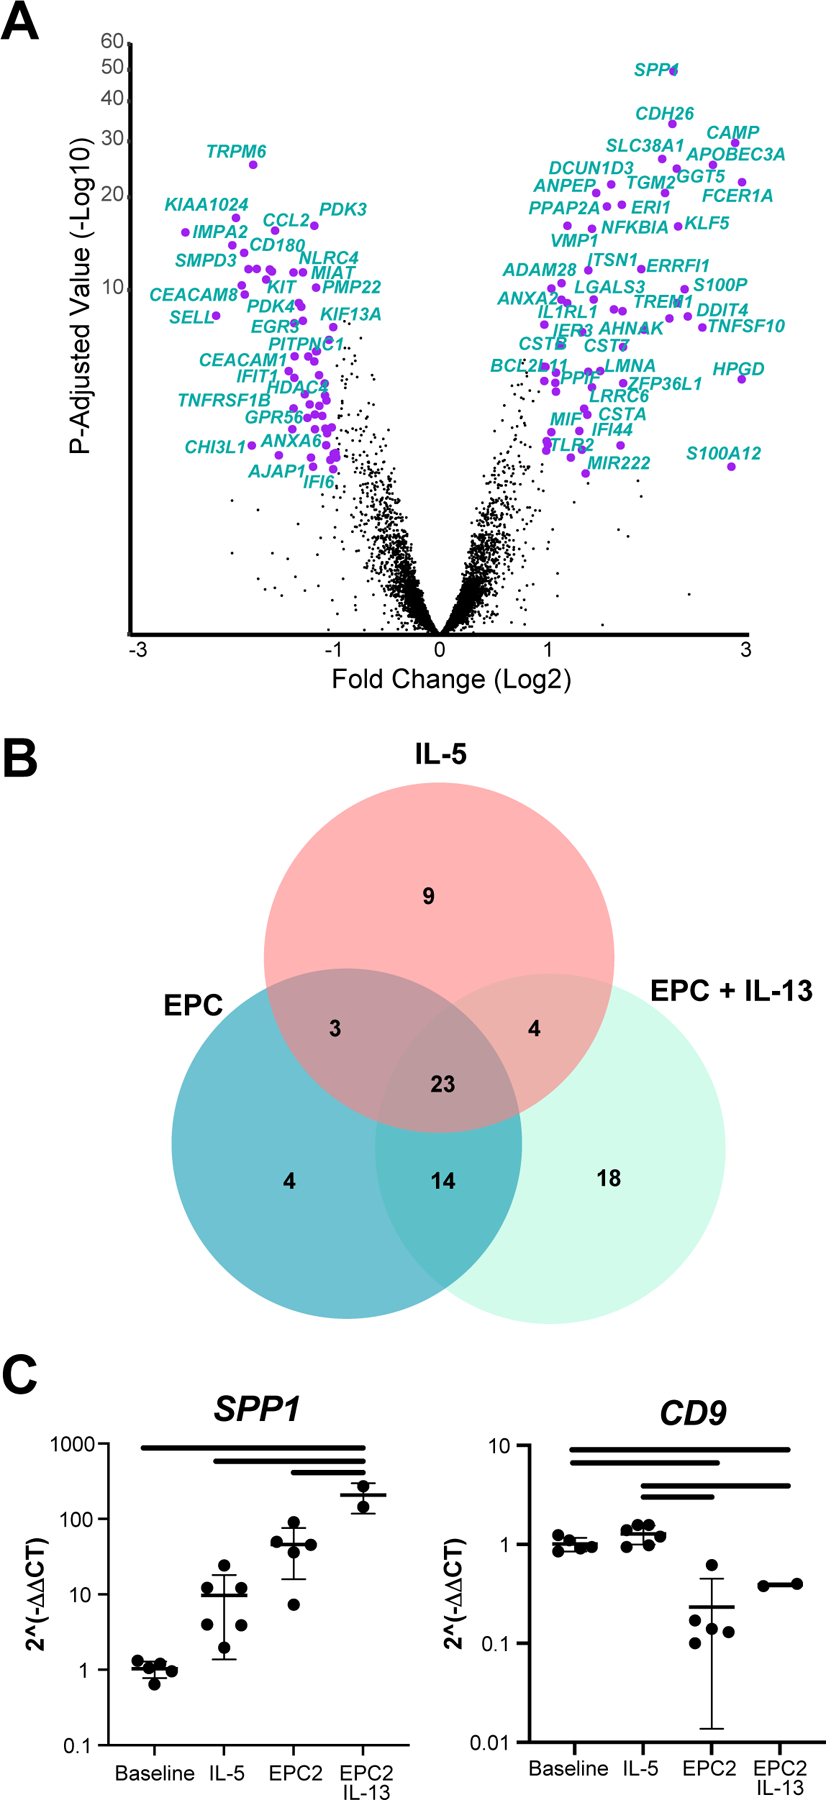
Figure 6. Tissue-specific responses of eosinophil gene expression to epithelial coculture.

(A) DEseq was used to compare gene expression in EPC2 cocultured eosinophils with and without IL-13. Genes with a fold change > 2 and an adjusted p value < 0.05 are annotated in purple, and select genes are labeled. (B) Genes that were identified as upregulated in esophageal eosinophils in a murine model of EoE were compared with the genes that were differentially expressed in our three culture conditions with respect to baseline state when isolated from human blood. Data represent a single biological replicate with 2–4 technical replicates per condition. (C) Selected genes were quantified by RT-PCR using RNA from 2–5 technical replicates and 3 biological replicates. Significant differences were assessed with one-way ANOVA and Tukey post-test. Bars indicate p < 0.01.
