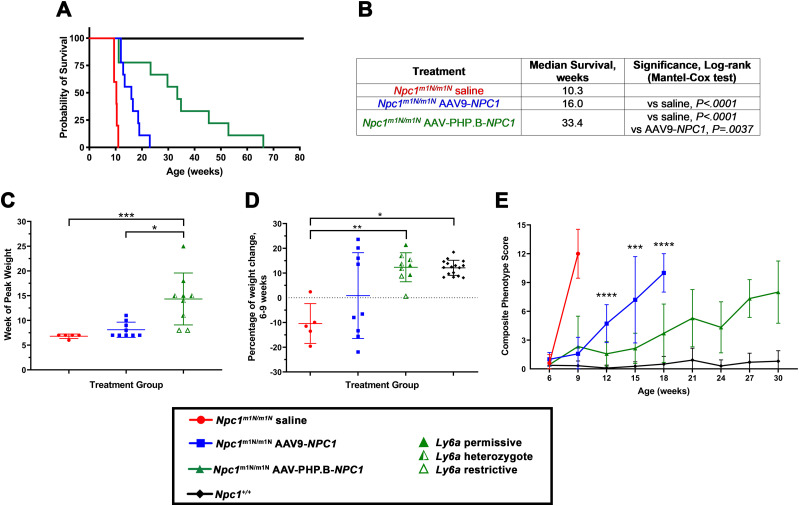
Figure 2. Npc1m1N/m1N mice treated with an NPC1 adeno-associated virus (AAV)-PHP.B vector showed increased survival and delayed disease phenotype progression.
(A) Kaplan–Meier curve depicts survival of the following: Npc1m1N/m1N mice treated with an AAV-PHP.B vector containing human NPC1 (1.43 × 10¹² genome copy), Npc1m1N/m1N mice treated with an AAV9 vector containing human NPC1 (1.84 × 10¹² genome copy), saline-injected Npc1m1N/m1N mice, and untreated Npc1+/+ controls. All mice were administered retro-orbital injections between P24 and P27. (A, B) Table of treatment group, median survival, and significance (Mantel–Cox log rank test) of data shown in (A). (C) AAV-PHP.B-NPC1–treated Npc1m1N/m1N mice reached peak weight at a significantly older age than saline-injected Npc1m1N/m1N mice and Npc1m1N/m1N mice receiving the AAV9-NPC1 vector (Kruskal–Wallis test with Dunn’s multiple comparisons test). AAV9-treated Npc1m1N/m1N mice showed no significant difference from saline-injected mice. (D) Graphical depiction of the percentage of weight change between 6 and 9 wk of age. AAV-PHP.B-NPC1–treated Npc1m1N/m1N mice and normal Npc1+/+ mice gained weight at a similar rate during this time period, both of which were significantly different from the marked weight loss exhibited by saline-injected Npc1m1N/m1N mice (Welch’s ANOVA test with Dunnett’s multiple comparisons test). AAV9-NPC1–treated mice showed wide variability spanning across the other three groups. (E) Composite phenotype scores for each treatment group, measured at 3-wk intervals starting at 6 wk of age. Npc1m1N/m1N mice treated with AAV-PHP.B-NPC1 maintained significantly lower composite scores compared to Npc1m1N/m1N mice treated with AAV9-NPC1 from weeks 12–18 (two-way ANOVA with Tukey’s multiple comparisons test). A full table of 2-way ANOVA results is presented in Table S1. Composite phenotype scores include disease-relevant measures of gait, kyphosis, ledge test, hind limb clasp, grooming, and tremor, with a higher score indicating a more severe disease phenotype. (A, B, C, D) For panels (A, B, C, D), n’s are as follows: Npc1m1N/m1N saline = 5, Npc1m1N/m1NAAV9-NPC1 = 9, Npc1m1N/m1N AAV-PHP.B-NPC1 = 9, Npc1+/+ = 14. (E) Of note for panel (E), the n of mice at each time point in all three Npc1m1N/m1N groups became smaller at later time periods because of animals reaching end stage (see Table S1). *P < 0.05, **P < 0.01, ***P < 0.001, ****P < 0.0001.

