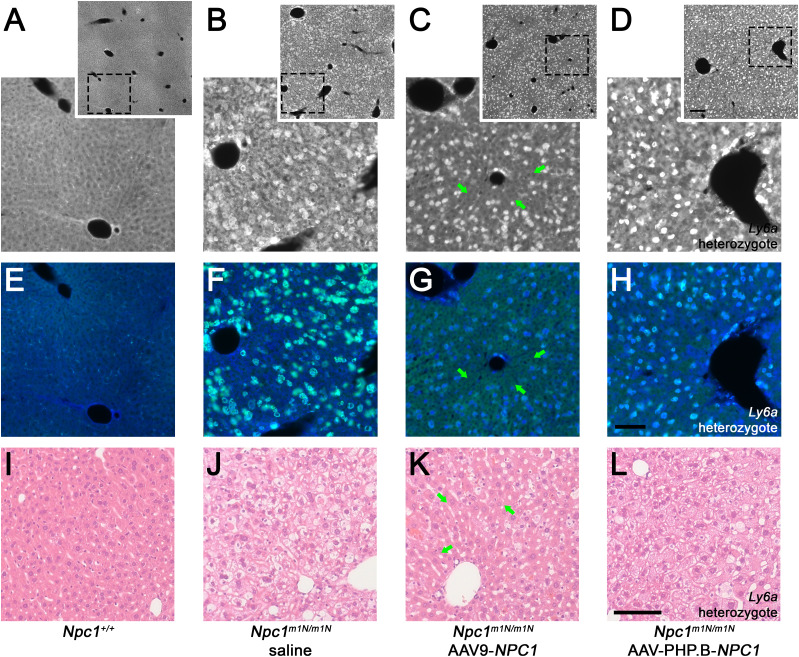
Figure 6. Differential impact of adeno-associated virus (AAV)9-NPC1 and AAV-PHP.B-NPC1 vectors on liver pathology.
(A, B, C, D, E, F, G, H) Cholesterol accumulation (visualized by Filipin labeling: white in top row, blue in middle row) is pronounced in both hepatocytes and Kupffer cells (CD68+ green in middle row) of saline and AAV-PHP.B-NPC1–treated Npc1m1N/m1N mice (B, D, respectively). (A, B, C, D) Insets (A, B, C, D) provide an overview of pathology. (C, G, K) Groups of corrected hepatocytes, though not Kupffer cells, are visible in the AAV9-NPC1–treated Npc1m1N/m1N mice (arrows in C, G, K) consistent with moderate pathology reduction. (I. J, K, L) Hematoxylin and eosin staining support the mildly reduced pathology found in AAV9-NPC1–treated Npc1m1N/m1N mice (K) as compared to saline or AAV-PHP.B-NPC1 treatments (J, L). (A, E, I) Normal Npc1+/+ liver is shown in (A, E, I) for comparison. Scale bars = 200 μm (insets only, top row) or 100 μm (all other panels).

