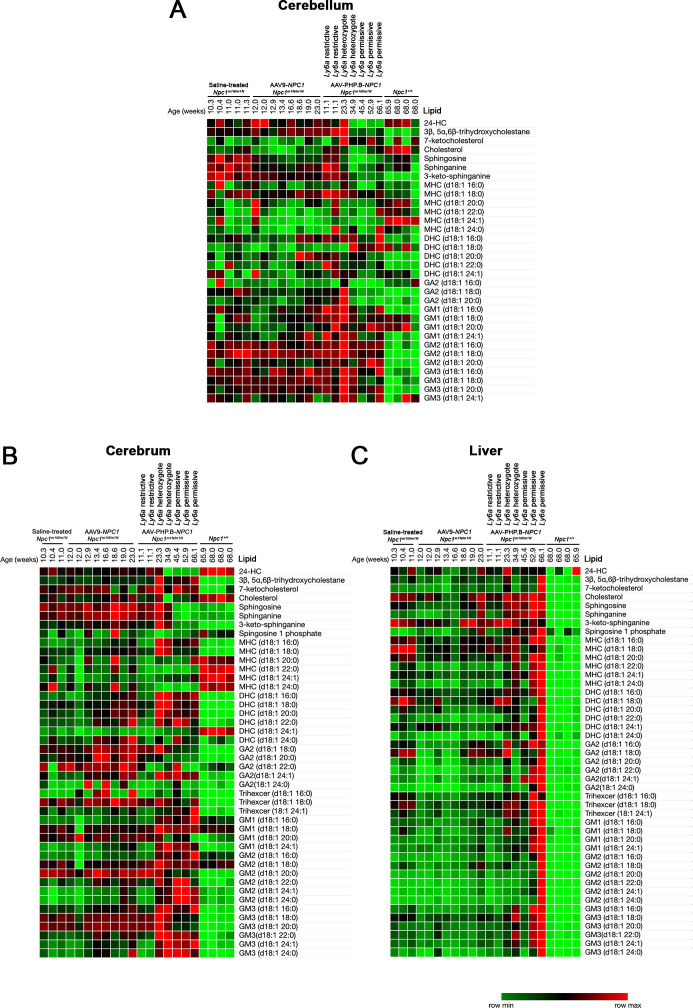
Figure S5. Metabolomics at the end stage reveal only modest changes resulting from treatment with either adeno-associated virus (AAV)9-NPC1 or AAV-PHP.B-NPC1.
(A, B) Metabolomics analysis of cerebellum and cerebrum tissues overall demonstrated little correction of the lipid pathology by either vector. The colorimetric scale (lower right) reflects the minimum and maximum levels of individual lipids in each row, with green indicating lowest levels, red indicating highest levels, and black indicating intermediate levels. Of note, several lipid species showed lower levels in brain in the three longest-lived AAV-PHP.B-NPC1–treated Npc1m1N/m1N mice that showed permissive Ly6a genotypes. These mice showed reduced levels of sphingosine, sphinganine, and 3-keto-sphinganine in both cerebellum and cerebrum (indicated by bright green), thus bringing the levels closer to those of Npc1+/+ mice. In addition, these three mice showed lower levels of GA2 species and 3β, 5α, 6β-trihydroxycholestane in the cerebellum in comparison with untreated Npc1m1N/m1N mice. (C) Metabolomics analysis of liver showed no notable correction of any individual lipid species in AAV-PHP.B-NPC1–treated Npc1m1N/m1N mice in comparison to saline-treated Npc1m1N/m1N mice, and the oldest AAV-PHP.B-NPC1–treated Npc1m1N/m1N mice showed broadly elevated lipid levels (indicated by red). However, AAV-PHP.B-NPC1–treated Npc1m1N/m1N mice did have an overall metabolomics signature more similar to Npc1+/+ mice, suggesting modest correction of liver disease in alignment with pathology findings. Heat maps were generated using Morpheus (https://software.broadinstitute.org/morpheus).

