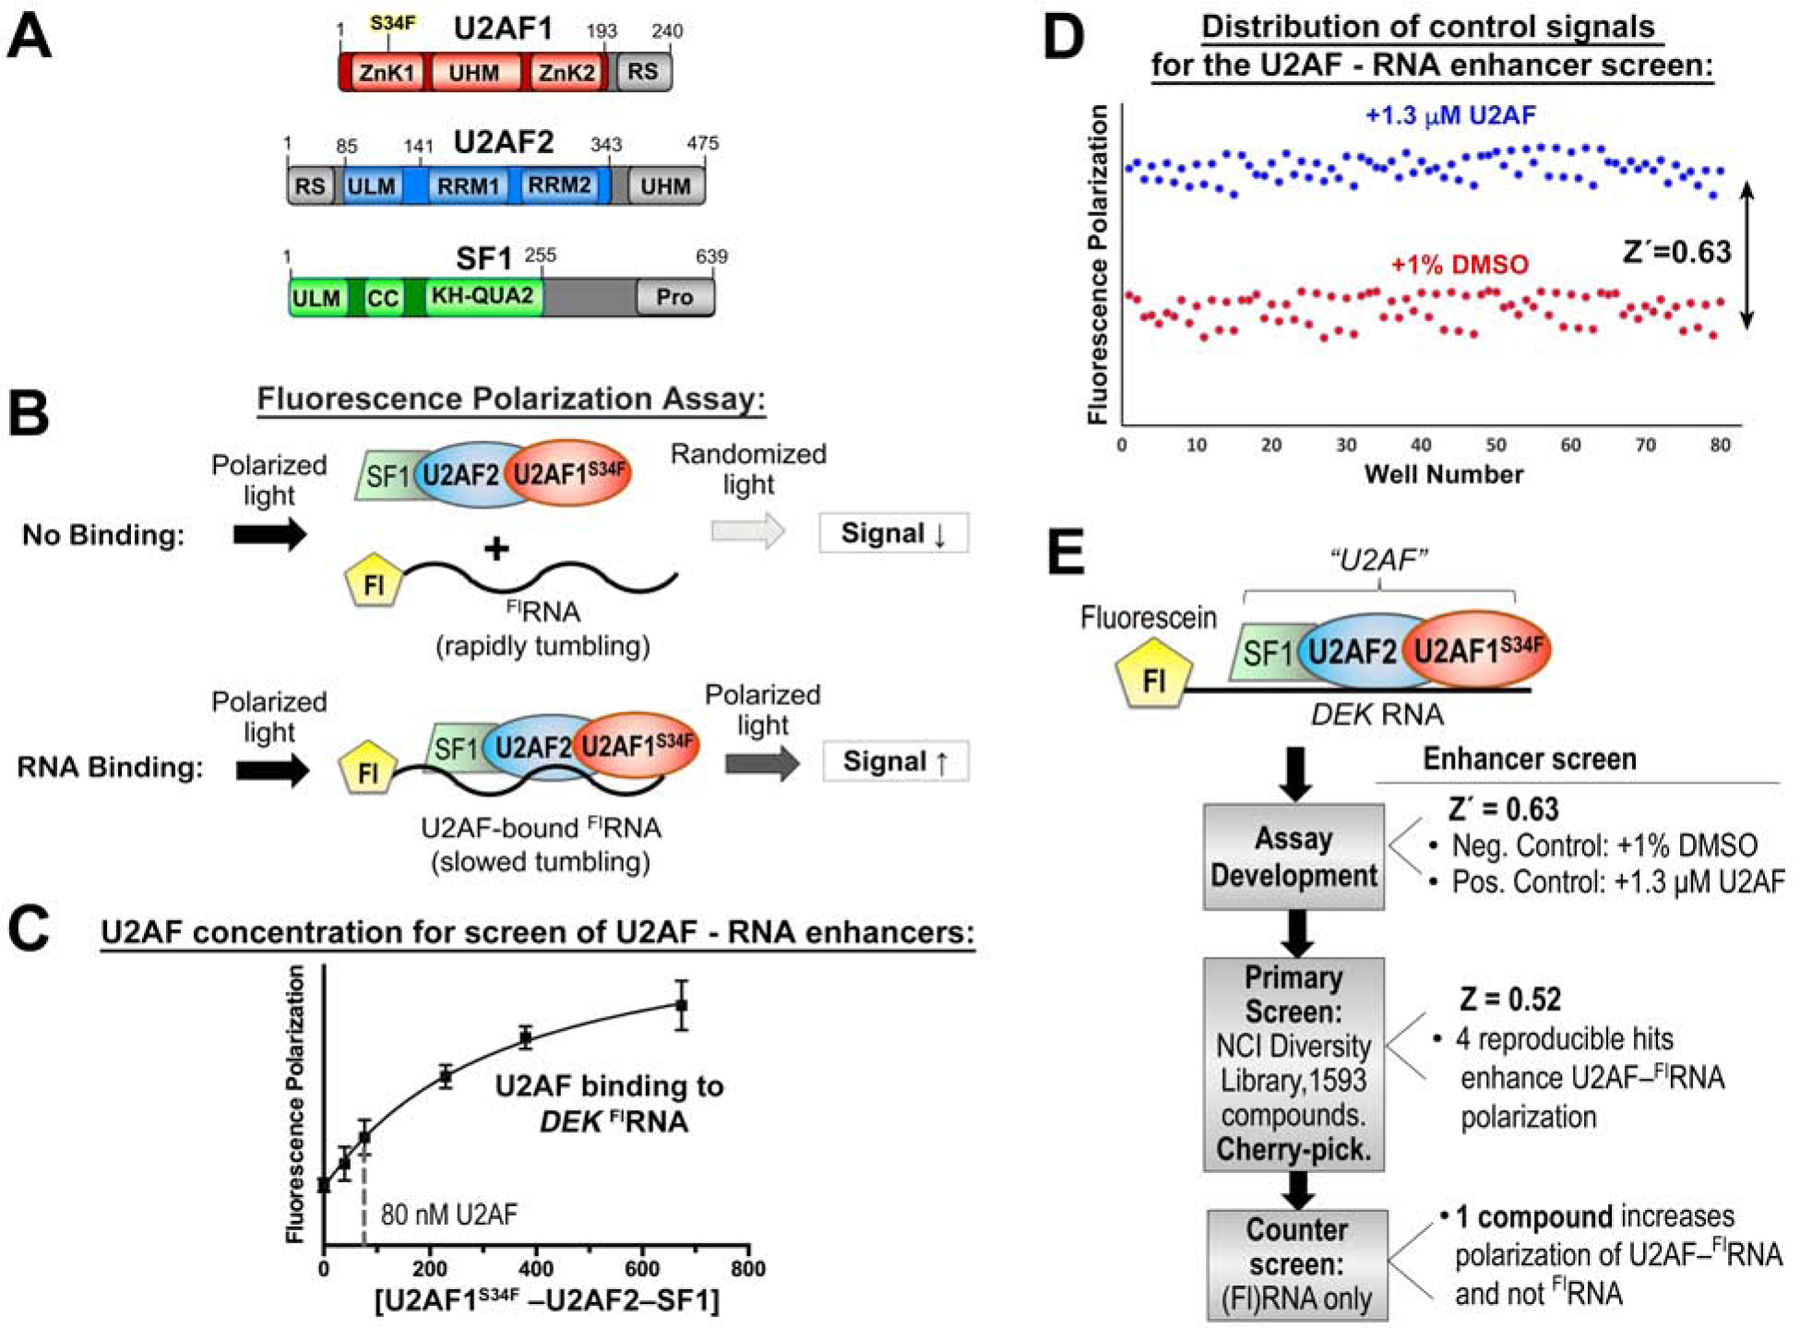
Figure 1.

A high-throughput screen for modulators of U2AF–RNA complexes. (A) Domains of U2AF1, U2AF2, and SF1 splicing factors. Gray, region excluded from the screened expression constructs. (B) Schematic diagram of the fluorescence polarization RNA binding assay. Fl, 5′ fluorescein. (C) Fluorescence polarization curve for U2AF1S34F–U2AF2–SF1 binding into fluorescein DEK FLRNA. The nonlinear fit (solid curve) is overlaid on the mean data points ± SD of three replicates. A dashed line marks the protein concentration used for the enhancer screen. (D) Distribution of positive (blue) and negative (red) control signals used for the calculation of the Z′-factors of the assay. (E) Overview of the screen. Results are summarized to the right and detailed in Table S1.
