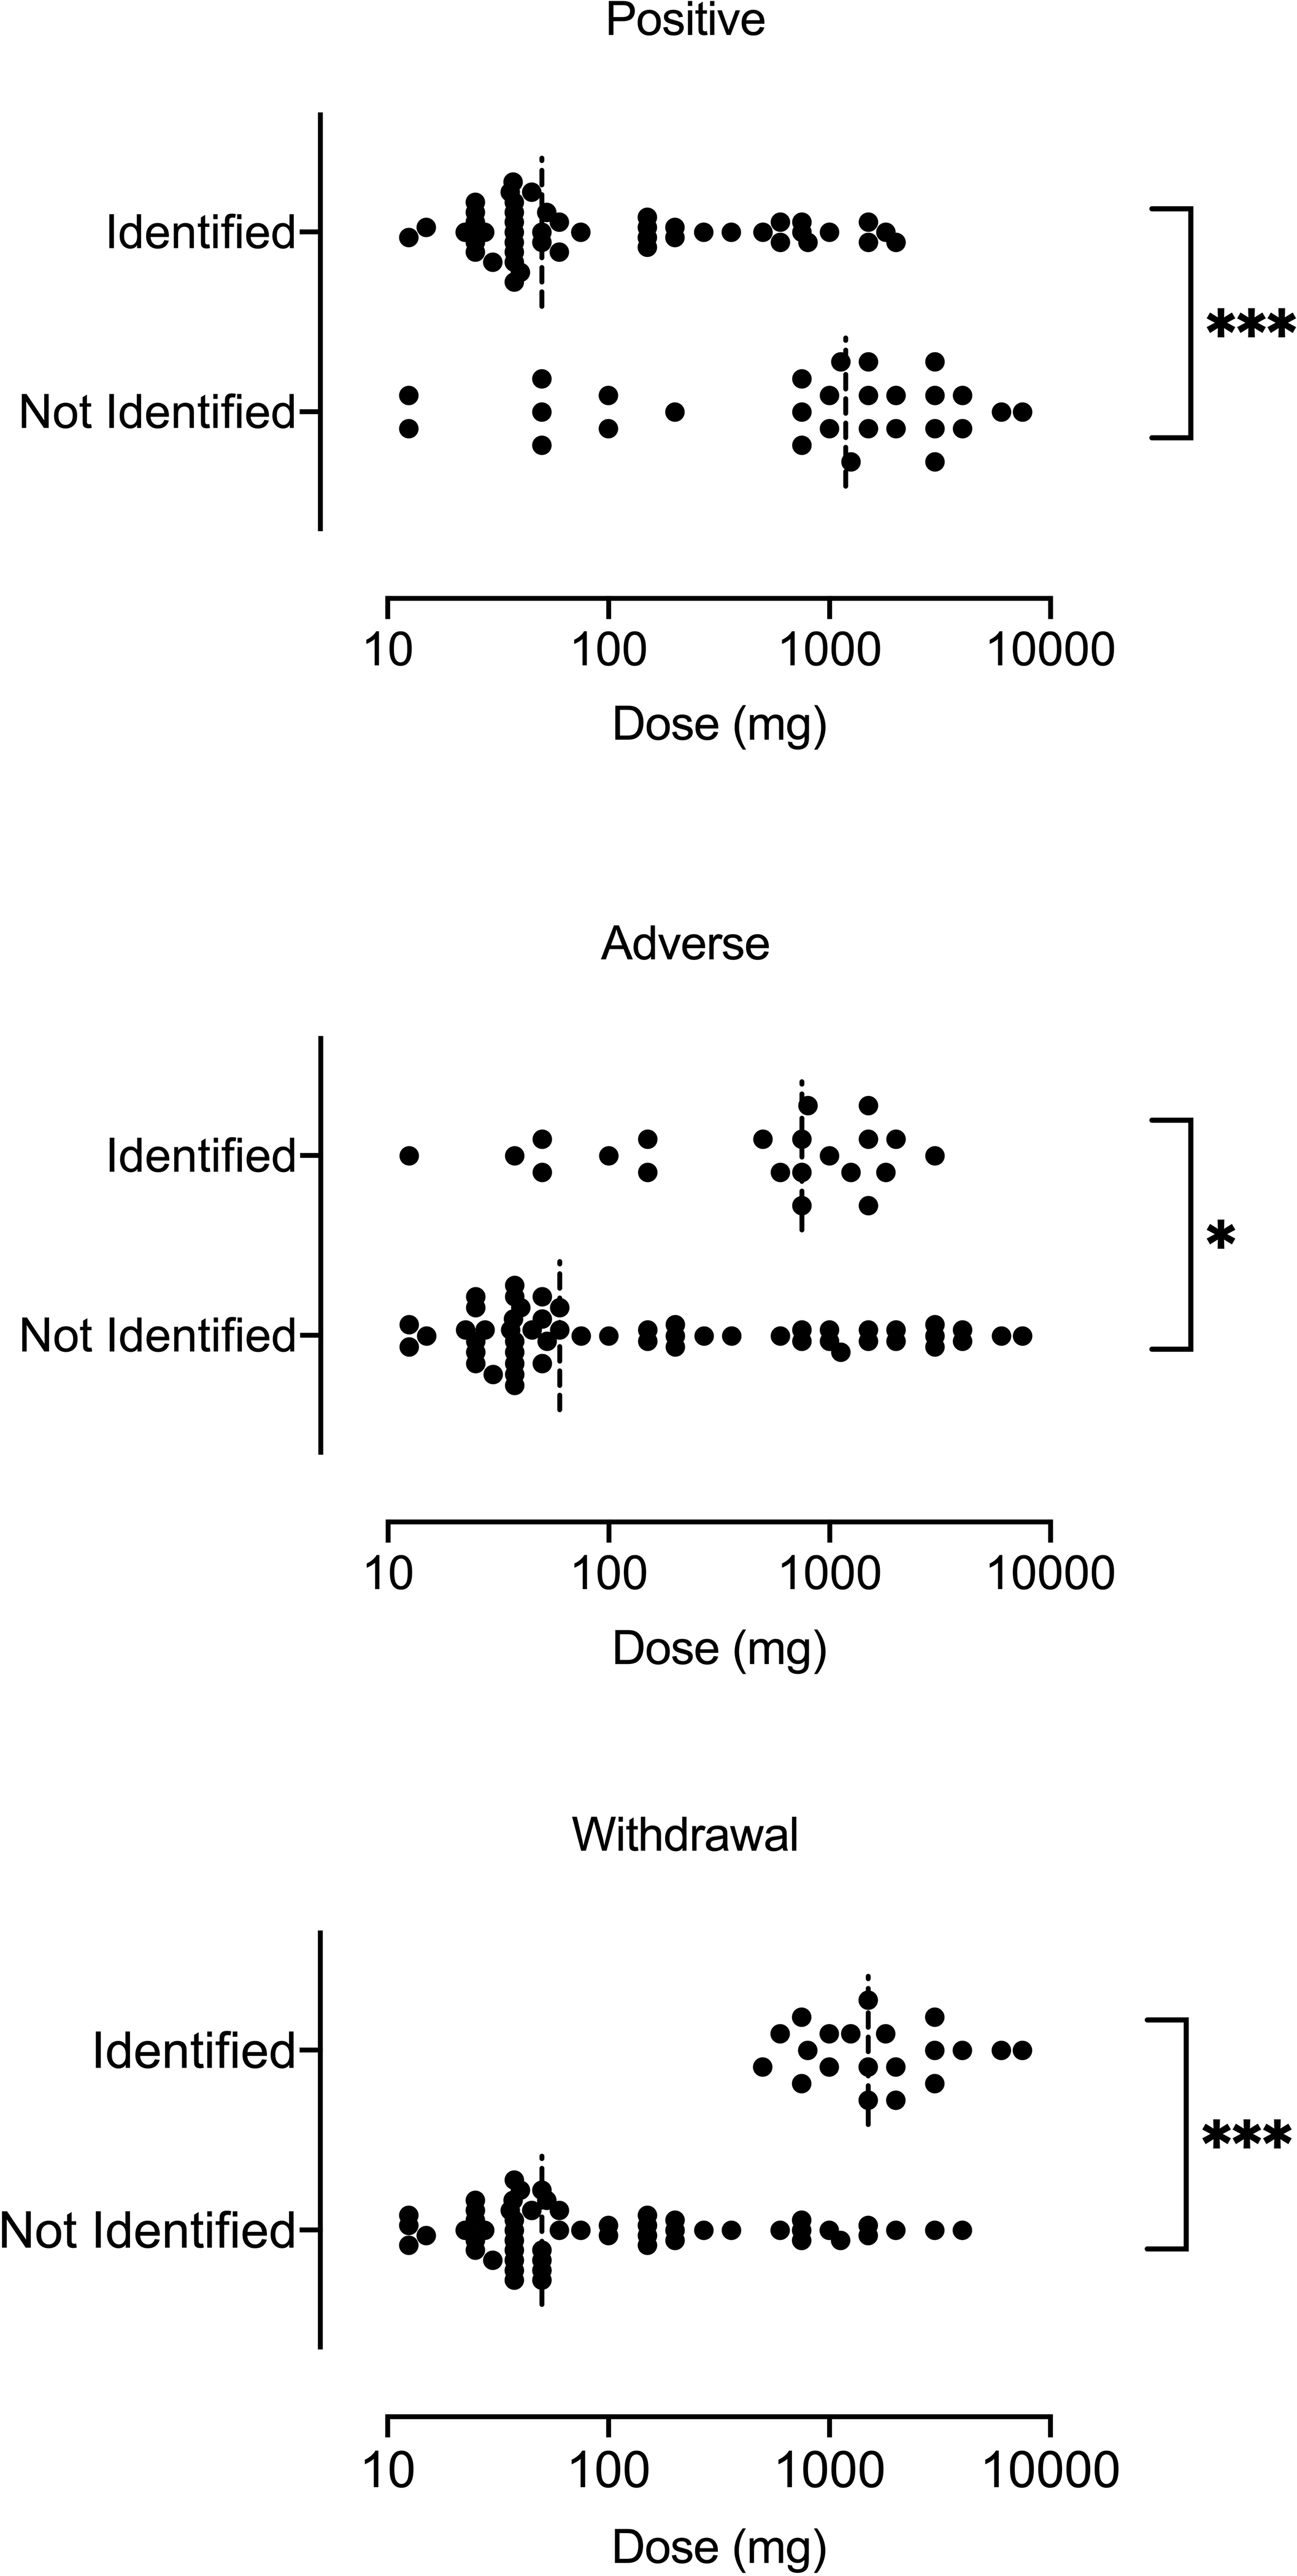
Figure 1.

Results from logistic regression showing coded subjective effects by daily dosing. This figure shows how tianeptine dose ranges, reported for a 24-h period, were associated with dichotomous variables for Identified (vs. Not Identified) “positive”, “adverse”, and “withdrawal” subjective effects attributed to tianeptine. Distributions of the dosing variable by coded variables of Identified positive effects (top panel), adverse effects (middle panel), and withdrawal effects (bottom panel). Vertical dashed lines are median dosing values. Dose is presented on a log scale. *p < .05; **p < .01; ***p < .001.
