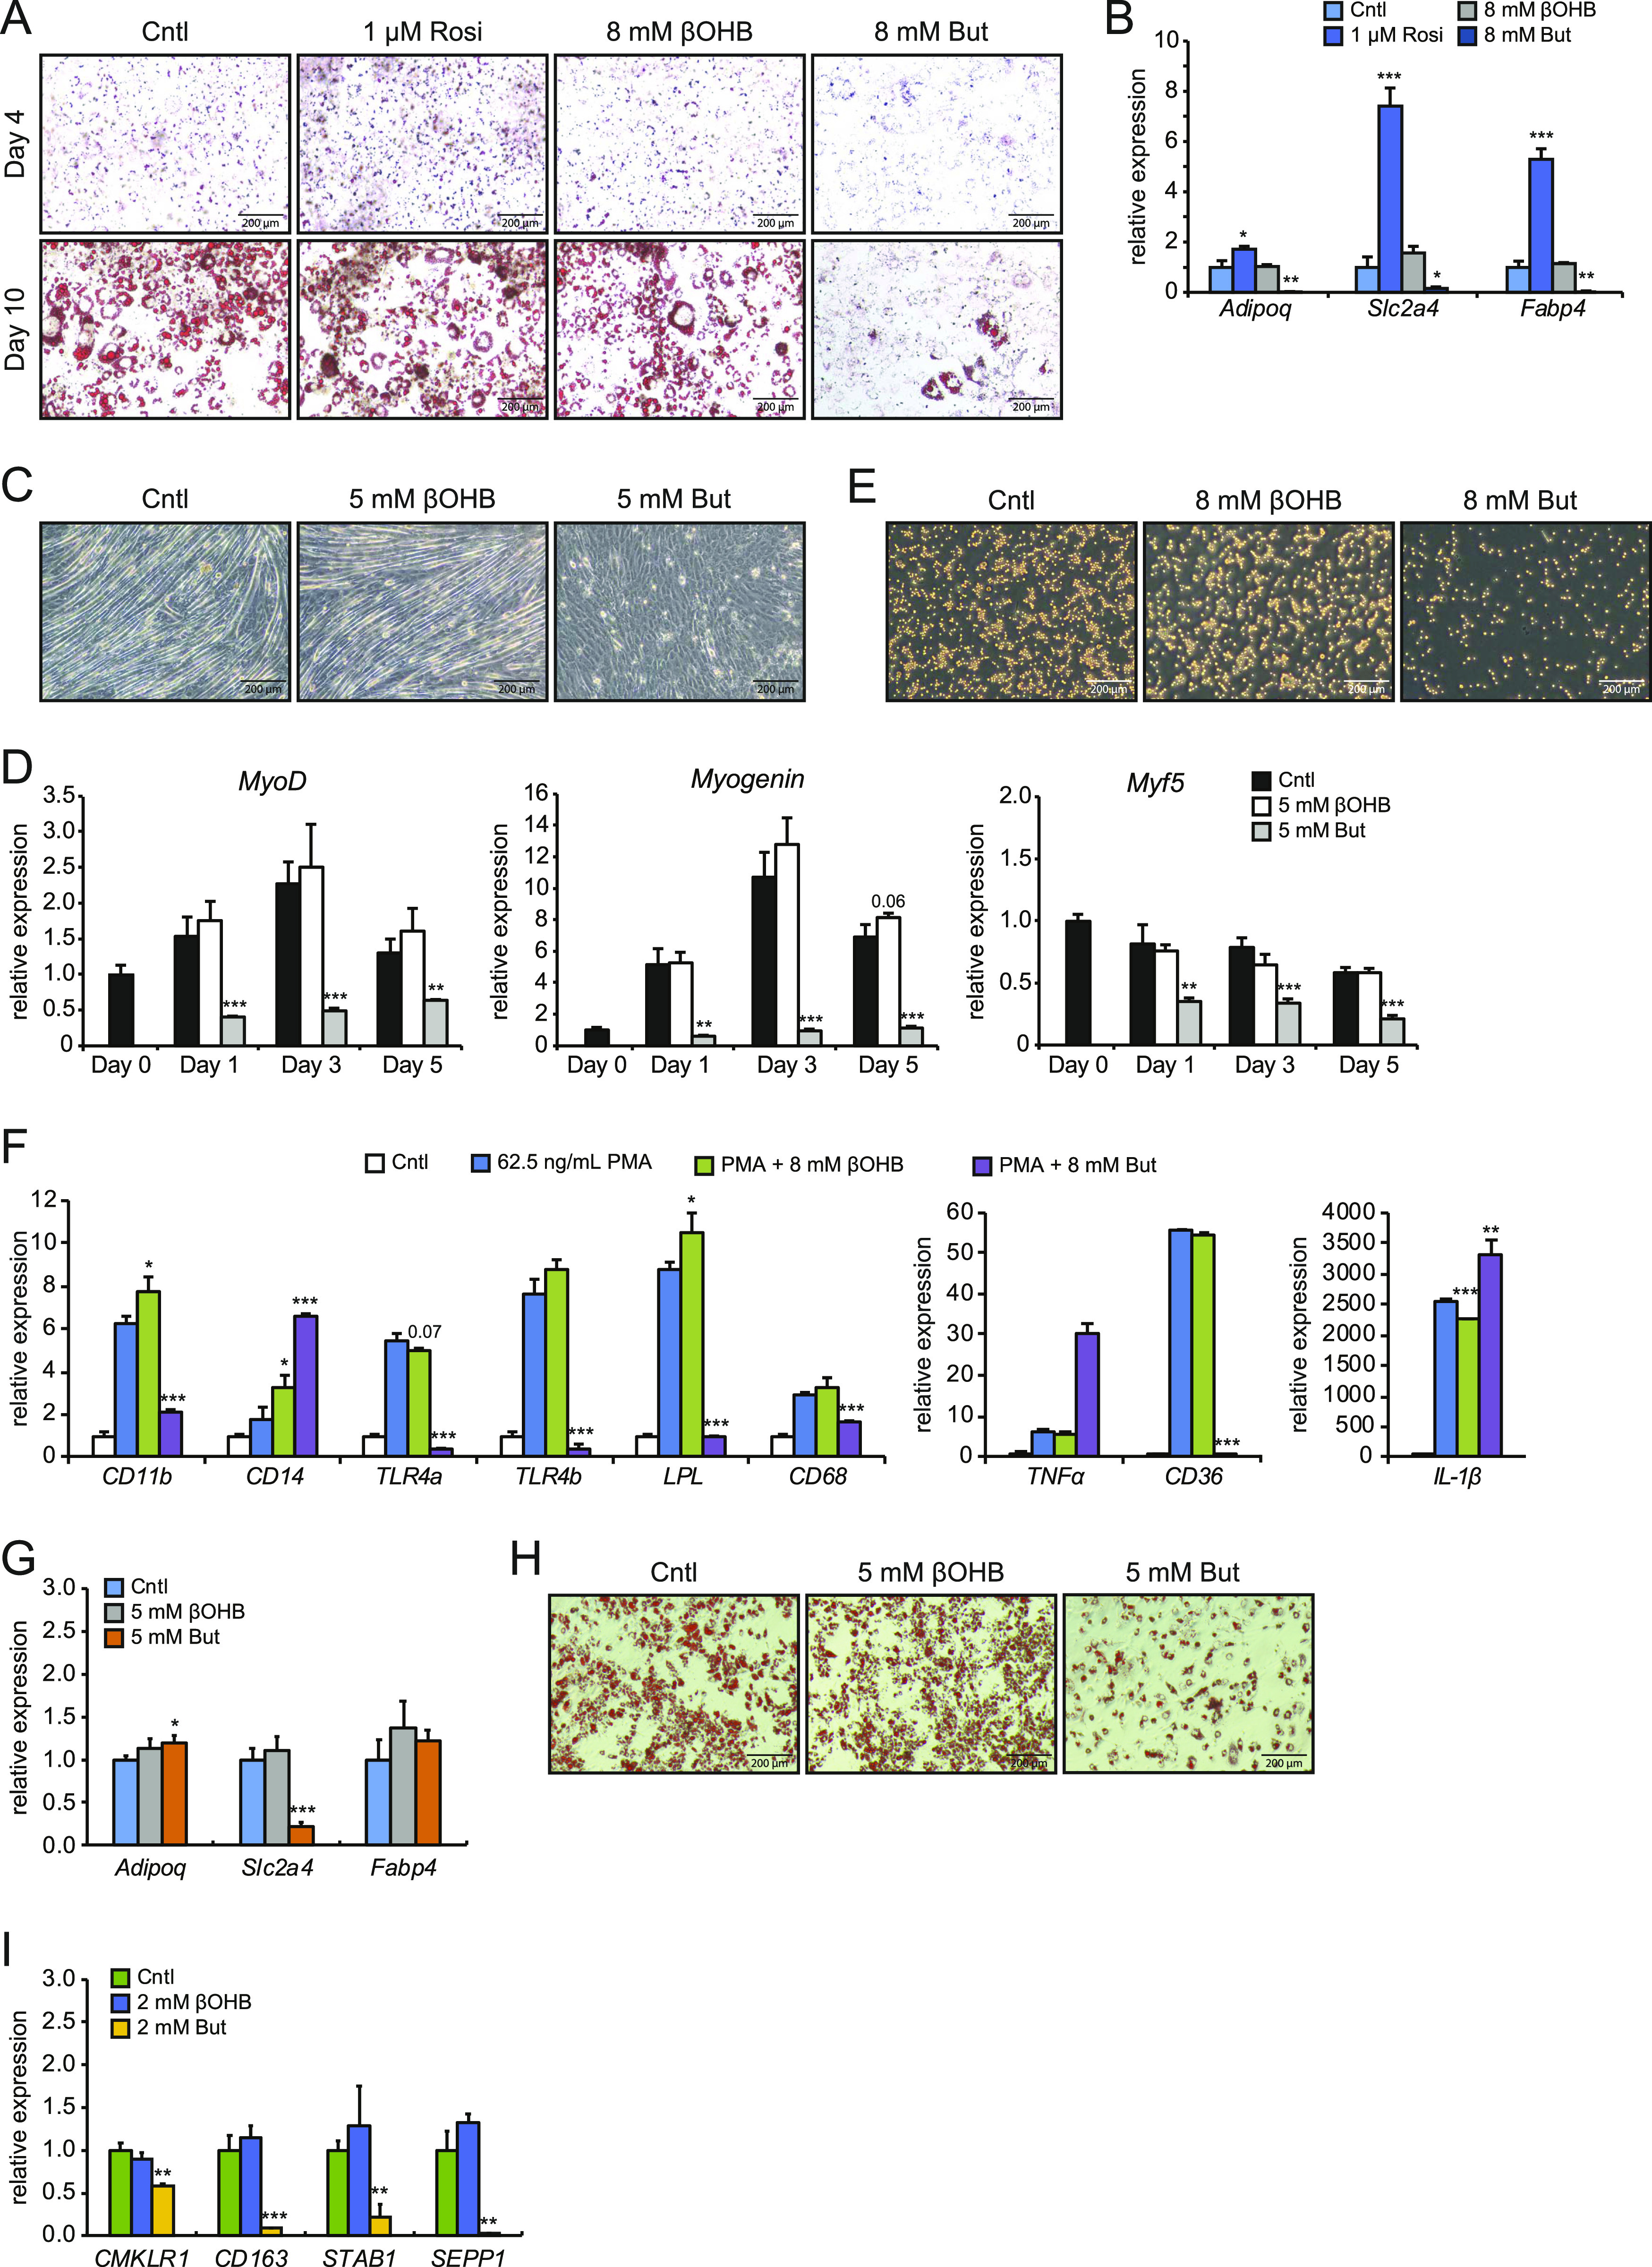
Figure 1. Differential effects of βOHB and butyrate on the differentiation process of adipocytes, myotubes, and macrophages.

(A) Representative Oil red O staining of 3T3-L1 adipocytes at Day 4 of the standard differentiation protocol in the presence of either 1 μM Rosi, 8 mM βOHB, or 8 mM butyrate. (B) Corresponding expression profile of differentiation markers and PPARγ targets determined by RT-qPCR at Day 4 using the mild differentiation protocol. (C) Representative microscopic pictures of C2C12 myotube formation after 5 d of differentiation in the presence of 5 mM βOHB or 5 mM butyrate. (D) Corresponding expression profile of myocyte differentiation markers MyoD, Myogenin, and Myf5 after differentiation. (E) Representative pictures of THP-1 cells differentiated for 24 h in 62.5 ng/ml PMA in presence of either 8 mM βOHB or 8 mM butyrate. (F) Corresponding expression profile of THP-1 differentiation markers. (G) Representative Oil red O staining of primary adipocytes at Day 7 of the standard differentiation protocol with either 5 mM βOHB or 5 mM butyrate. (H) Corresponding expression profile of adipogenesis differentiation markers as determined by RT-qPCR at Day 4 of differentiation. (I) Gene expression of differentiation markers for human primary monocytes after 7-d culture in M-CSF with either 2 mM βOHB or 2 mM butyrate. Error bars represent SD. Asterisks indicate significant differences according to t test compared with control (of respective day) or PMA treatment (*P < 0.05; **P < 0.01; ***P < 0.001).
