
Figure 2. Disparate effects of βOHB and butyrate on gene expression in primary adipocytes, macrophages, myocytes, and hepatocytes.
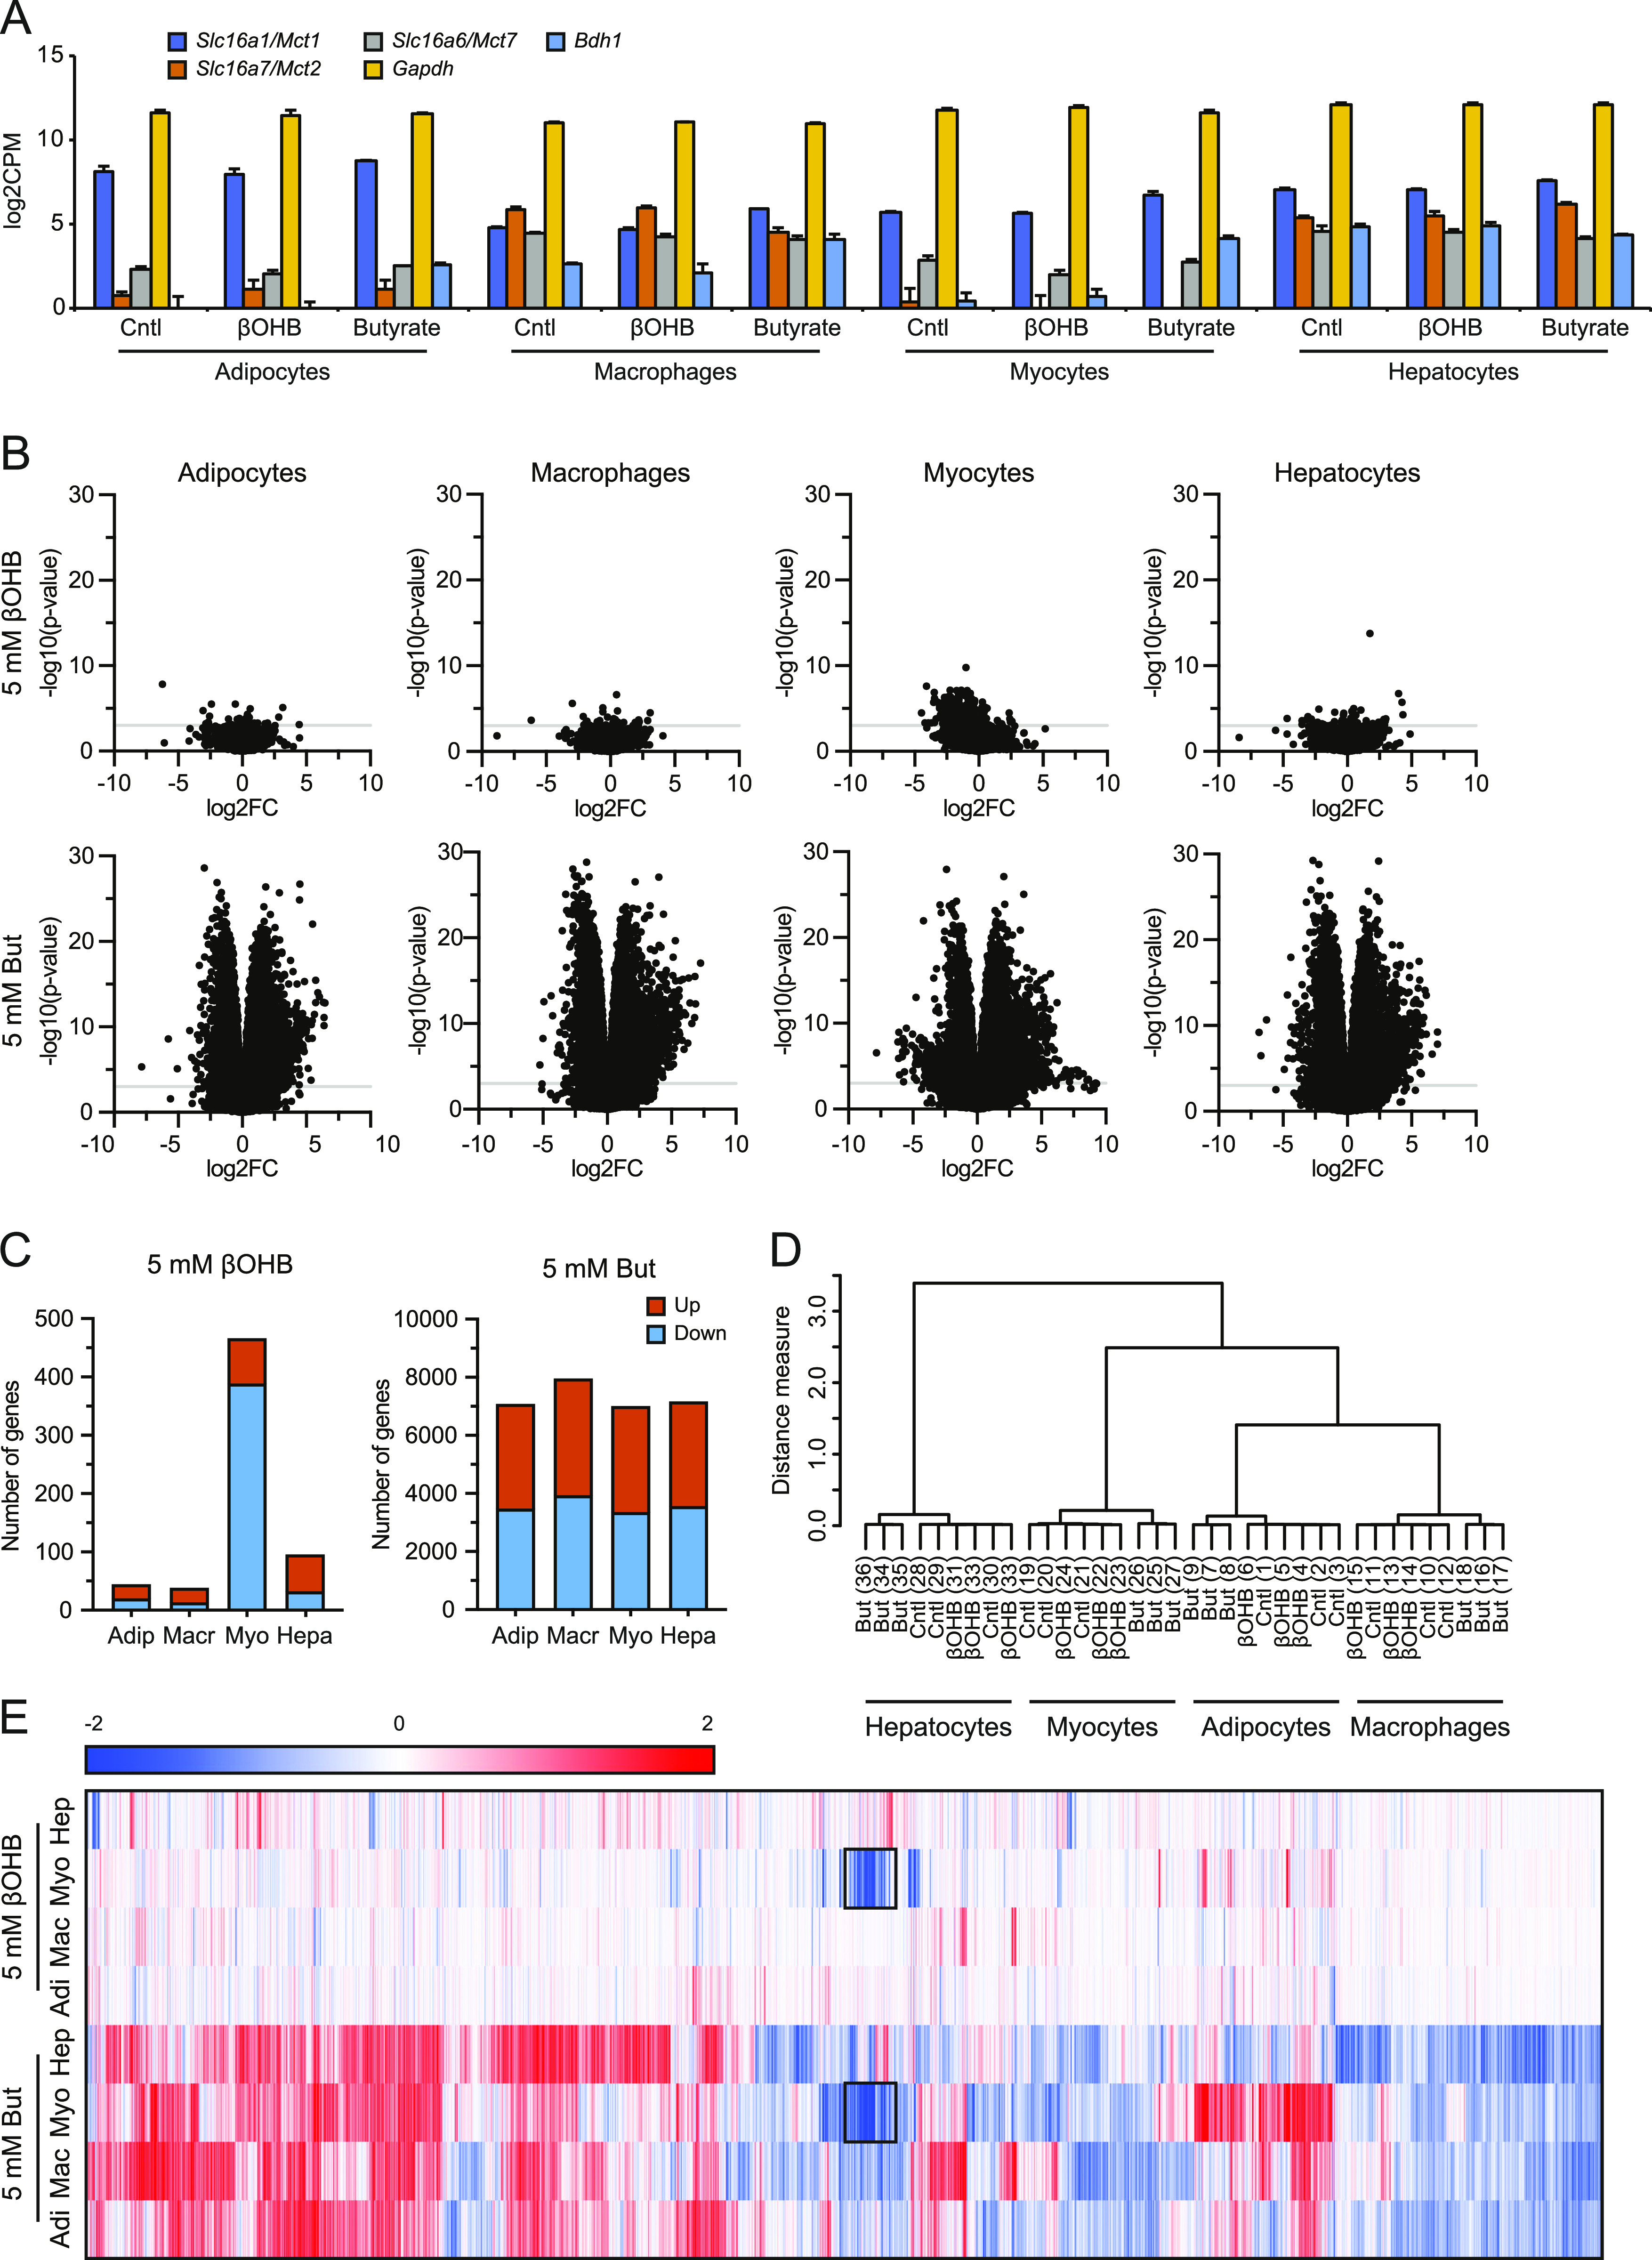
(A) Expression levels (log2CPM) of Bdh1 and monocarboxylate transporters Mct1, Mct2, and Mct7 in relation to Gapdh. (B) Volcano plots showing log2[fold-change] (x-axis) and the −10log of the raw P-value (y-axis) for every cell type treated with βOHB and butyrate. The grey line indicates P = 0.001. (C) Number of genes significantly (P < 0.001) altered by treatment with βOHB and butyrate. (D) Hierarchical clustering of βOHB and butyrate-treated samples. (E) Hierarchical biclustering of βOHB and butyrate-treated samples visualized in a heat map. Clustered are significant differentially expressed genes based on Pearson correlation with average linkage. Red indicates up-regulated, blue indicates down-regulated. Black rectangle marks genes that appear similarly regulated by βOHB and butyrate in myocytes.