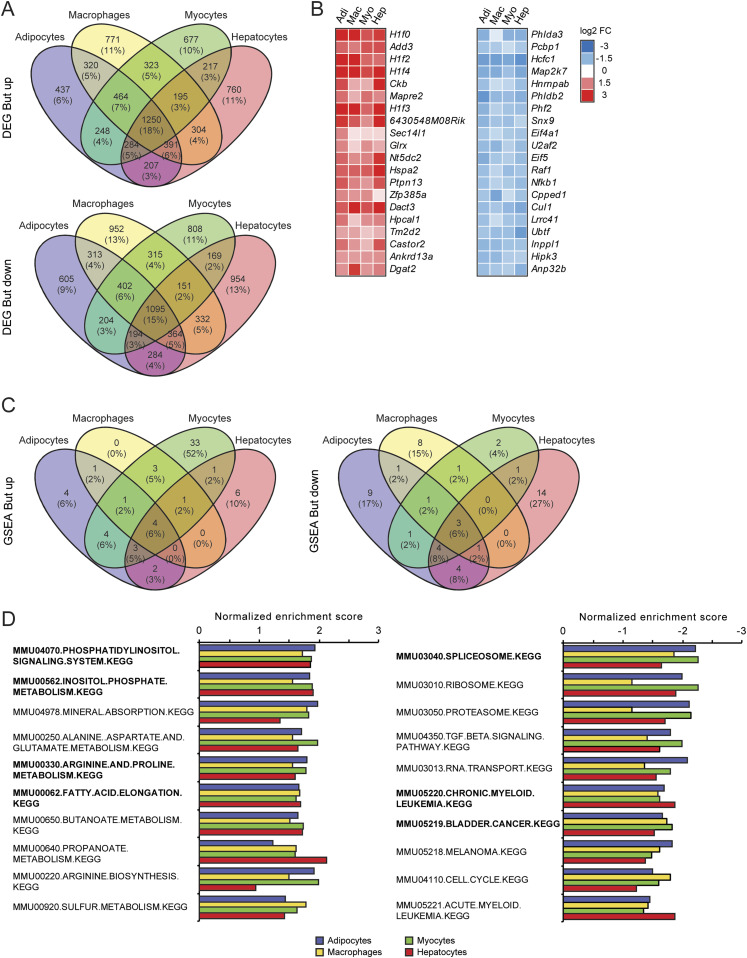
Figure 3. Consistency of gene expression changes elicited by butyrate.
(A) Venn diagrams showing overlap in significantly regulated genes by butyrate between cell types (P < 0.001), separated into up- and down-regulated genes. (B) Heat maps showing genes that are significantly up- or down-regulated by butyrate in all four cell types (P < 0.001). Genes are sorted by statistical significance. (C, D) Top 10 up- and down-regulated gene sets in βOHB (C) and butyrate-treated cells (D). Gene sets were determined by gene set enrichment analysis based on t-values and are ranked according to averaged normalized enrichment score. Pathways in bold are significantly enriched in all four cell types.

