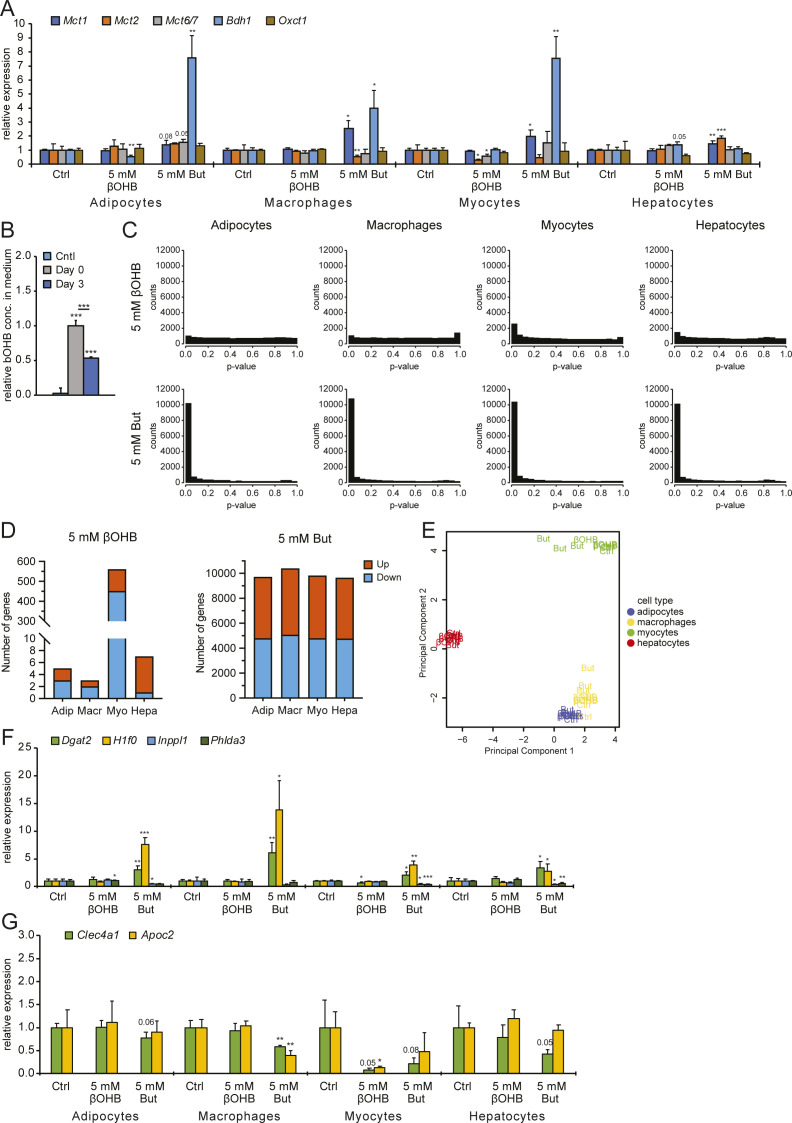
Figure S2. Gene expression effects by βOHB.
(A) qPCR analysis of expression changes for Bdh1, Oxct1, and monocarboxylate transporters Mct1, Mct2, and Mct7 in relation to Gapdh. Compare with Fig 2A. (B) Colorimetric analysis of βOHB utilization by primary adipocytes after 3 d in culture. (C) Raw P-value histograms for butyrate and βOHB-treated cell types. (D) Number of genes significantly altered by treatment with βOHB and butyrate (FDR q < 0.05). (E) Principle component analysis of βOHB and butyrate-treated samples. (F) qPCR analysis of expression changes for Dgat2, H1f0, Inppl1, and Phlda3 (target genes significantly regulated by butyrate) in relation to Gapdh. Compare with Fig 3B. (G) qPCR analysis of expression changes for Clec4a1 and Apoc2 (target genes significantly down-regulated by βOHB) in relation to Gapdh. Compare with Fig 4E and Table S1. Error bars represent SD. Asterisks indicate significant differences according to t test compared with control (*P < 0.05; **P < 0.01; ***P < 0.001).

