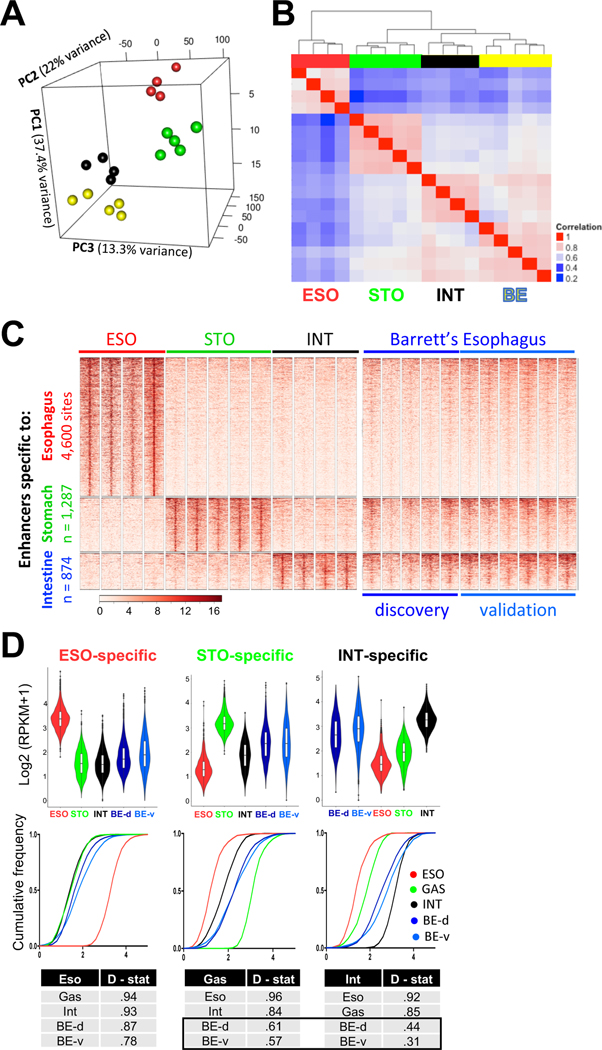
Figure 1. BE specimens carry intestinal and gastric, but not esophageal, enhancers.
(A) Principal Component Analysis of the highest quintile of variable enhancers. Esophageal (red, n = 4) and gastric (blue, n = 5) epithelia form discrete clusters. Enhancers marked in BE (yellow, n = 5) are distinct from those in the native esophageal mucosa and most similar to those in the intestine (black, n = 4).
(B) Pearson correlation coefficients among active enhancers (H3K4me2 peaks >2 kb from transcription start sites, TSSs). In unsupervised hierarchical clustering, the BE enhancer profile (n=5) is most similar to intestinal (INT) mucosa (n=4) and related to stomach (STO, n= 5), but not to esophageal (ESO) squamous epithelium (n=4).
(C) H3K4me2+ enhancers marked uniquely in stratified esophageal (4,600 sites), stomach corpus (1,287 sites) or intestinal (874 sites) epithelium. Five original (discovery set) and 6 additional (validation set) BE samples show H3K4me2 at intestinal and gastric, but not at esophageal, enhancers. Heatmap scale, 0 to 16 units.
(D) Quantitation of the above H3K4me2 FiT-seq data, represented in violin plots and cumulative frequencies. Because the large volume of data ensures significant p-values for differences across all sample pairs, we applied the Kolmogorov-Smirnov test to measure similarities and differences across enhancer signatures (D-statistic, where lower values reflect greater similarity). Each quantitative measure reveals the BE enhancer signature as similar to those of stomach and intestine, but not the esophagus.

