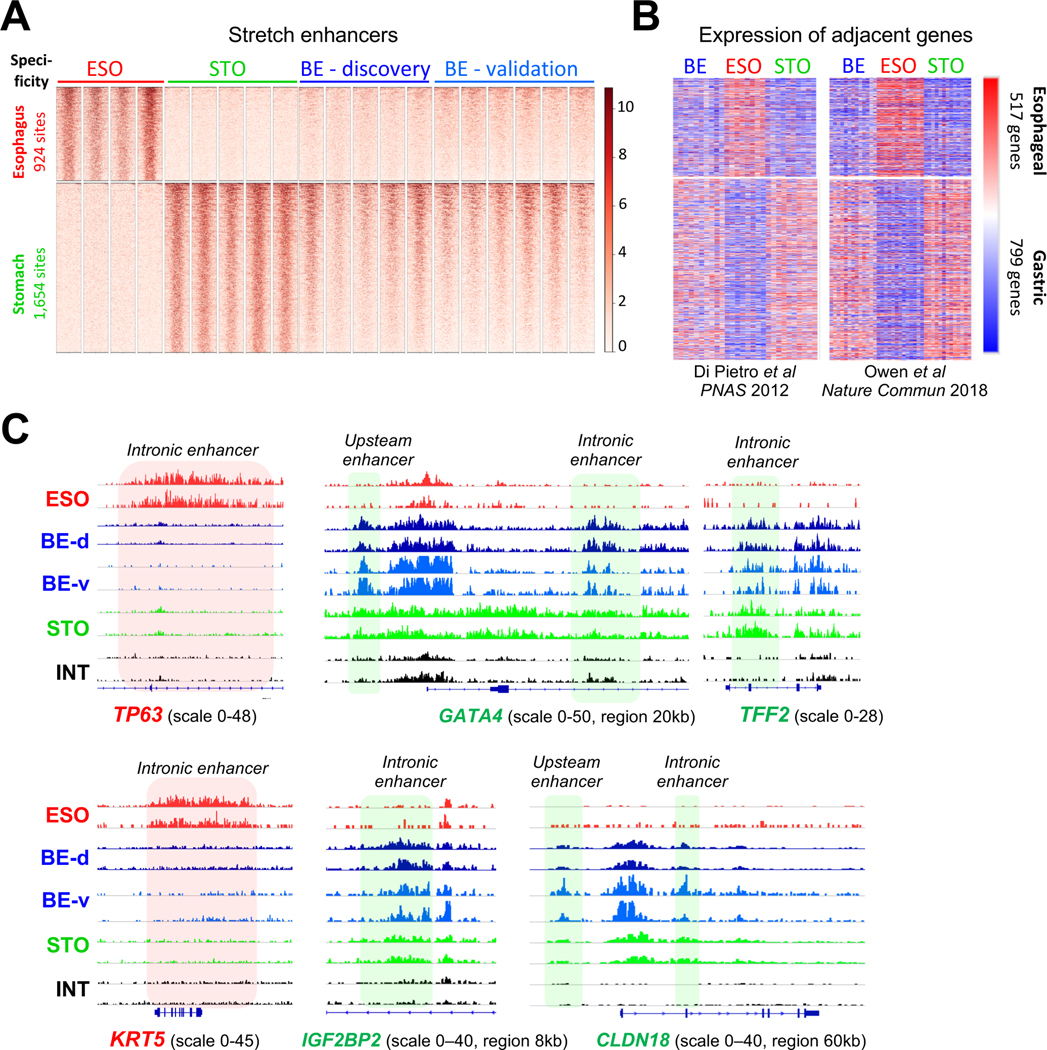
Figure 2. Stomach stretch enhancer activity and a gastric gene signature in BE.
(A) H3K4me2 ChIP signals in BE specimens at 924 esophagus- (ESO) and 1,654 stomach-(STO) specific ‘stretch’ enhancers, showing marks at STO but not signature ESO regions. ESO, n=4; STO, n=5; BE-discovery, n=5; BE-validation, n=6.
(B) Relative mRNA levels of 517 genes encoded <100 kb from ESO-specific and 799 genes encoded <100 kb from STO-specific stretch enhancers, determined from gene expression datasets reported in Refs. 14 and 34, respectively. Blue=low, red=high mRNA expression. Enhancer marks in BE correlate with expression of nearby STO, and not ESO, genes.
(C) Data tracks from H3K4me2 FiT-seq at enhancers in ESO, STO, INT, and BE specimens. TP63 and KRT5 loci are selectively marked in ESO, as expected, but not in BE. Conversely, enhancers near GATA4, TFF2, IGF2BP2, and CLDN18 are marked in STO and BE samples, but not in ESO or INT.

