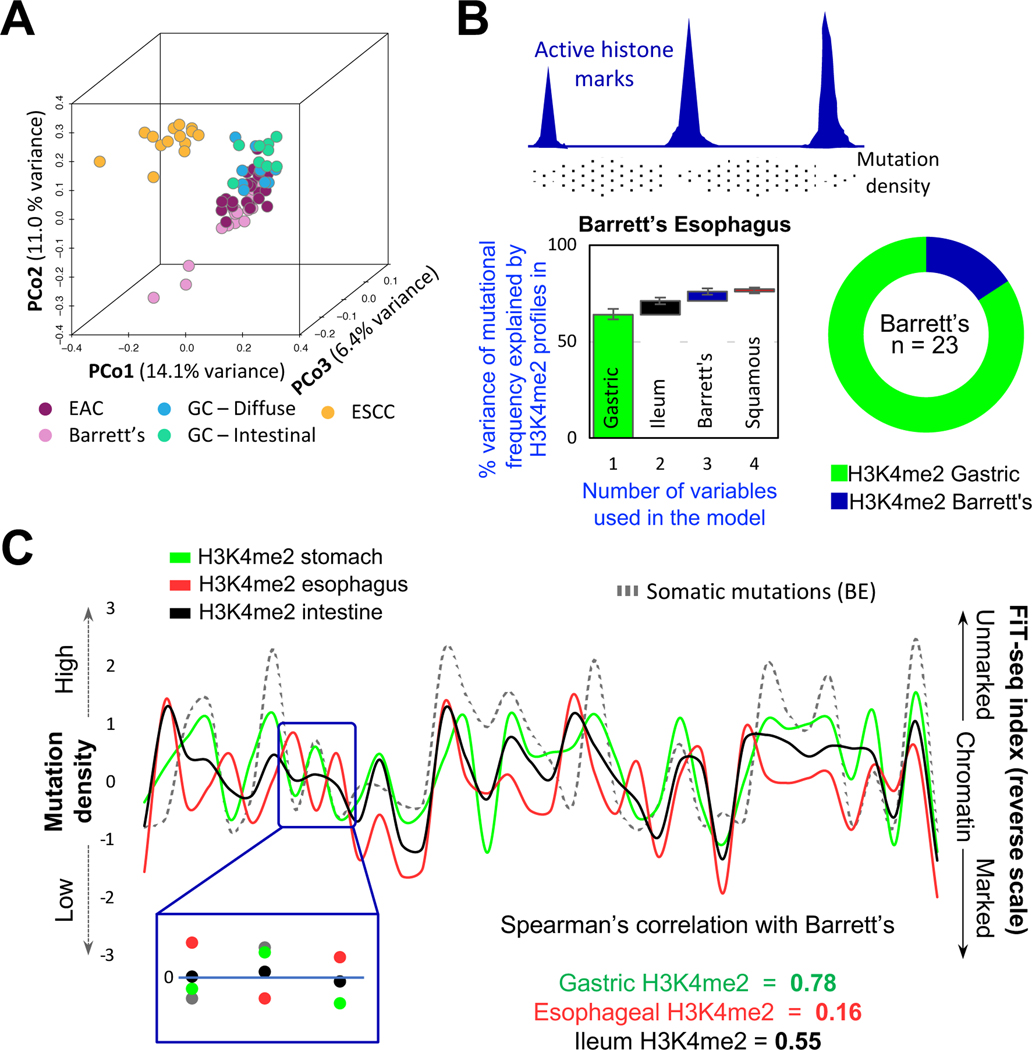
Figure 3. Mutational profiles in BE imply a gastric, not esophageal, origin.
(A) Principal coordinate (PCo) analysis of genome-wide somatic mutation data from BE, esophageal squamous cell carcinoma (ESCC), esophageal adenocarcinoma (EAC), and gastric cancers (GC) of the diffuse or intestinal types. BE mutational profiles overlap substantially with those in EAC and GC and differ from those in ESCC.
(B) Top, Illustration of the inverse relation of somatic mutation density and enhancer chromatin, likely reflecting differential access to DNA repair. Bottom, A random-forest machine-learning approach revealed that the enhancer H3K4me2 landscape of normal gastric epithelium was the best predictor of mutational variance in 23 BE samples, with small incremental contributions from other landscapes. The algorithm was run on grouped (graph – first bar depicts the largest contributor; subsequent columns represent incremental contribution of additional variables) or individual (donut) BE samples. In both analyses, the gastric signature best explained mutations found in BE.
(C) A representative 38-Mb region showing correlation between mutation frequency in BE (left y-axis) and absence of enhancer marking in normal gastric chromatin (right y-axis), whereas absence of enhancer marks in stratified esophageal and intestinal epithelium correlated poorly.

