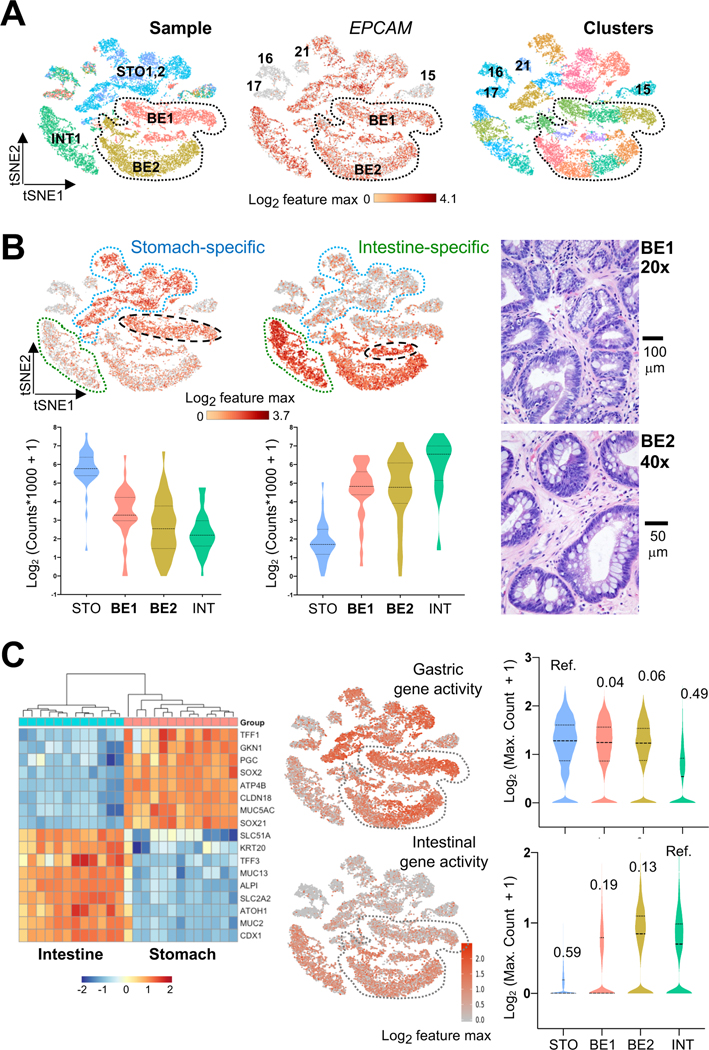
Figure 4. Single-cell resolution of hybrid gastric/intestinal chromatin states in BE.
(A) All informative cells (after filtering by CellRanger criteria) projected on a tSNE plot to reduce data dimensionality. Cells are color coded by sample (left, BE1 and BE2: Barrett’s esophagus cases 1 and 2; STO1,2: stomach cases 1 and 2; INT1: intestine) or graph-based cell clusters (right). ATAC signals at the EPCAM promoter identify epithelial cells. BE1 and BE2 cells are demarcated. Non-epithelial cells from all samples (clusters 15–17, 21) showed ATAC signals at VIM and CD45 (Fig. S3D).
(B) Distribution of single cells from BE (histology shown to the right), INT (green outline), and STO (blue outline) specimens in graph-based scATAC-seq clusters. Aggregate signals for open chromatin at stomach- (n=37) or intestine- (n=32) restricted enhancers are projected onto the tSNE plot, showing co-activity of tissue-specific regions throughout BE1 and BE2 (bottom right epithelial clusters), with the two BE1 sub-clusters (dashed black ovals) showing relative enrichment of STO or INT enhancers. Violin plots represent the average signal on each enhancer across all epithelial cells in the indicated specimens.
(C) Aggregate ATAC scores at panels of classic intestinal and gastric marker genes (left, RNA-seq data from Ref. 14; blue=low, orange=high RNA expression) projected onto the tSNE plot. Single cells in both BE samples (grey dotted space) show extensive co-activity and signals (log-transformed maximum counts per cell) are quantified on the right, with the similarities across samples estimated using D-statistics from the Kolmogorov-Smirnov test (noted above each violin plot; lower values reflect greater similarity; STO and INT samples serve as references).

