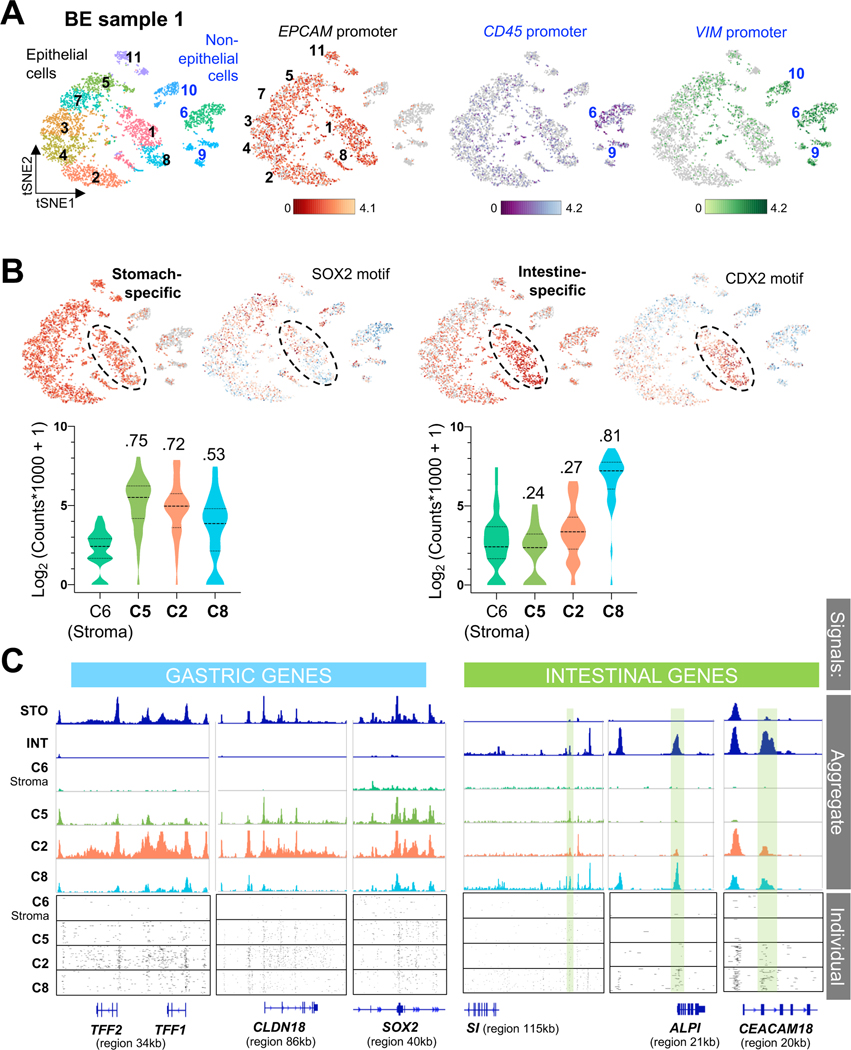
Figure 5. Heterogenous gastric and intestinal cis-element repertoires in BE.
(A) Independent clustering and tSNE projection of cells from BE case 1, with ATAC signals at the EPCAM promoter distinguishing epithelial (black numbers) from non-epithelial (blue numbers, open chromatin at the VIM promoter) populations. Clusters 6 and 9 likely represent blood-derived cells (open CD45 promoter chromatin); CD45-negative cluster 10 likely represents mesenchymal cells.
(B) Graph-based (tSNE) clustering of single BE1 cells, showing focal increase of intestinal cis-element signal (n=37) in specific clusters, with abundant stomach-specific enhancer signals (n=36) throughout the epithelial component. Clusters enriched for intestinal cis-elements were also enriched for intestinal (CDX2) and depleted of stomach (SOX2) TF sequence motifs. Cells within clusters 5, 2 and 8, for example, show different degrees of stomach- and intestine-restricted enhancer co-accessibility. Average signals on each enhancer are plotted for all cells in the indicated clusters and quantified in violin plots. Cluster 2 shows a stomach-dominant pattern, whereas cluster 8 shows substantial intestinal enhancer activity alongside stomach enhancers. D-statistics (Kolmogorov-Smirnov test) noted above each violin estimate similarity between cell populations, using stromal cell cluster 6 as the reference.
(C) Chromatin accessibility at classic gastric and intestinal gene loci in cells from BE1 epithelial clusters 5, 2 and 8, showing different degrees of stomach and intestinal differentiation; cluster 6 (non-epithelial stromal cells) serves as a control. Aggregate (pseudo-bulk) signals from STO and INT samples and BE1 cell clusters are displayed at the top. Cluster 8 shows notable cis-element co-accessibility near intestinal and gastric genes, while cluster 2 has few open intestinal sites (green shaded boxes) and prominent signals at gastric loci. Below, chromatin accessibility at these loci is displayed for 100 random single cells from each cluster.

