
Figure 2. Associations of phthalate metabolites in quartiles with hormones (n=718).
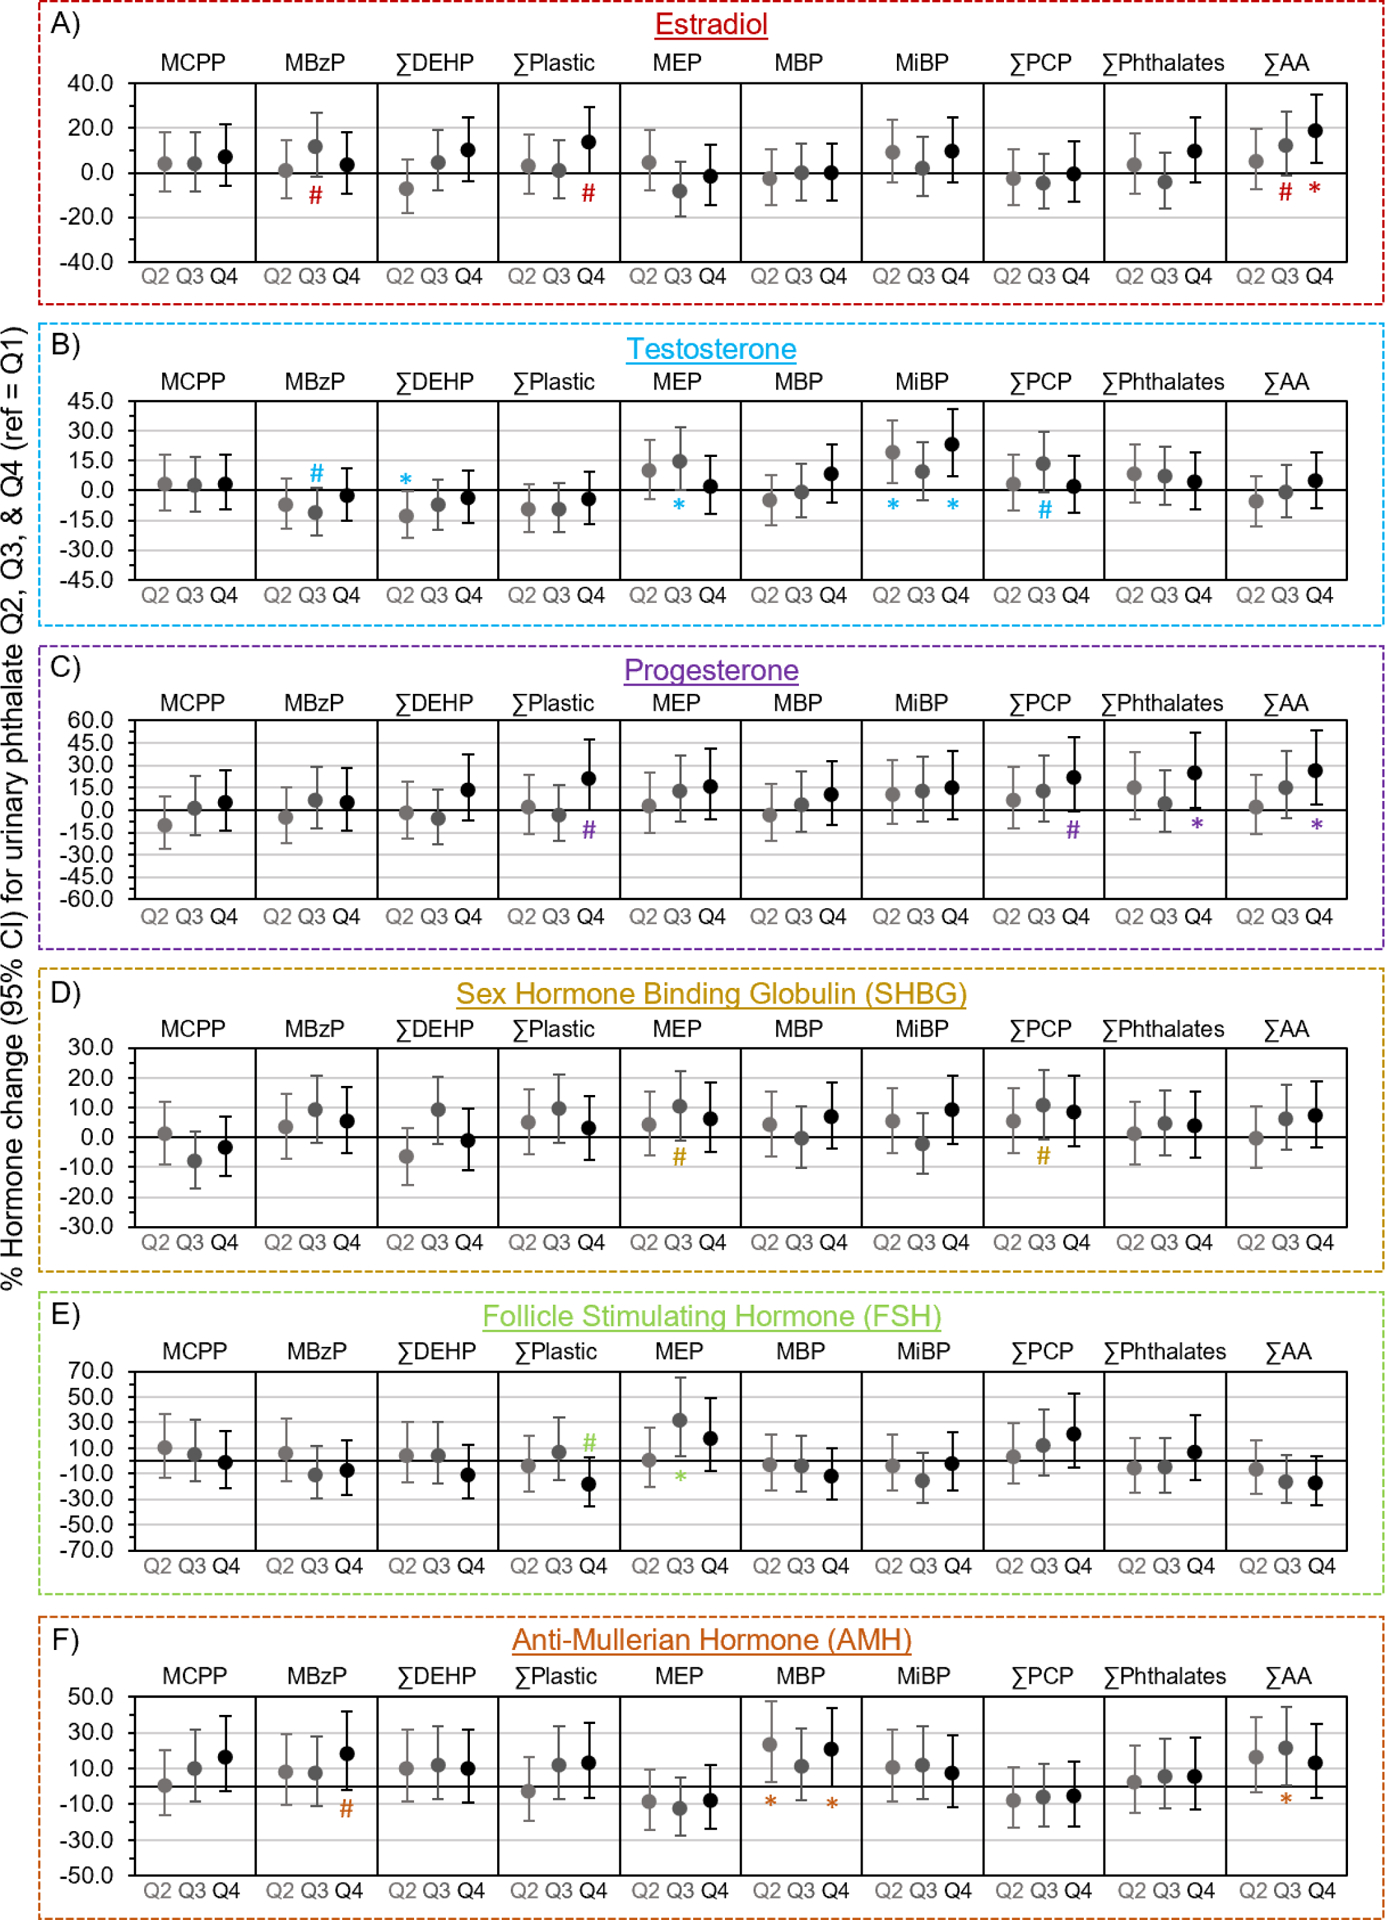
Multivariable generalized linear models evaluated associations of urinary phthalate concentrations with A) estradiol, B) testosterone, C) progesterone, D) sex hormone binding globulin (SHBG), E) follicle stimulating hormone (FSH), and F) anti-Mullerian hormone (AMH). Data are presented as % change (filled circles) and 95% confidence interval (solid lines) comparing phthalate quartiles 2 (Q2), 3 (Q3), and 4 (Q4) to quartile 1 (Q1). Models were adjusted for age, race, employment status, education, income, marital status, alcohol consumption, smoking status, physical activity, medication use, menopausal status, and body mass index. Confidence intervals that do not cross the null are significantly different from quartile 1 at #P<0.10 and *P<0.05.