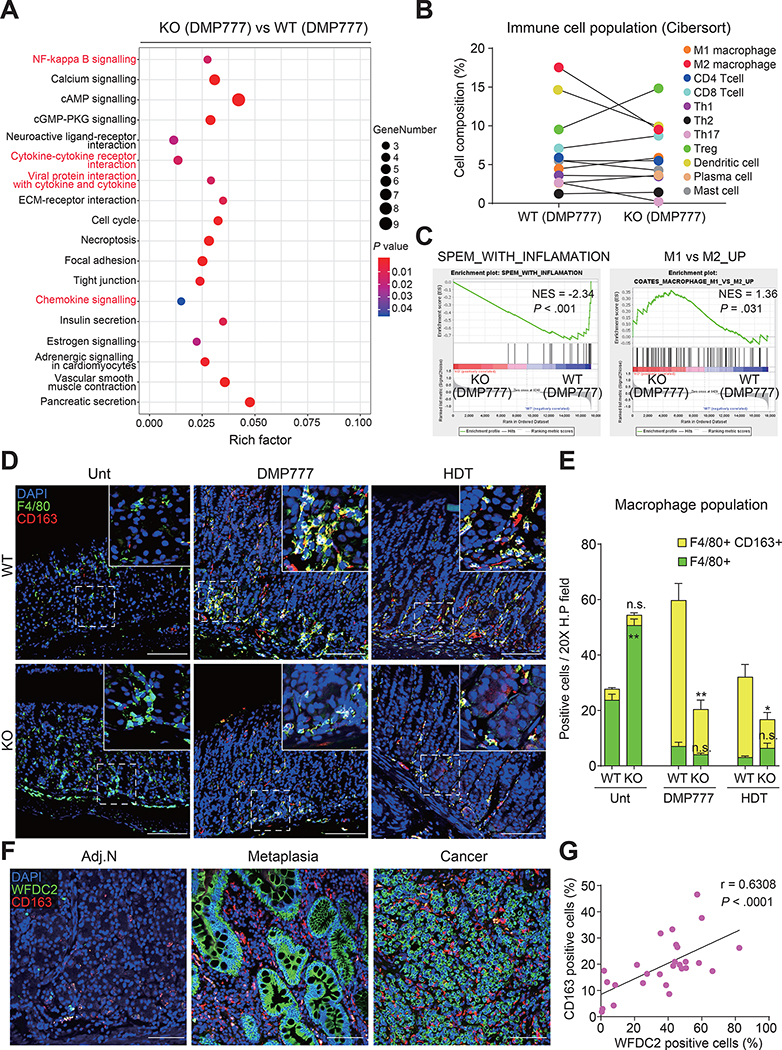
Figure 4. Decrease in M2 macrophage accumulation in Wfdc2-knockout (KO) mice after DMP-777 treatment.
(A) Bubble plot showing selected top 18 terms of enriched KEGG pathways. P values were derived from Fisher’s exact test. (B) Computational comparison of average immune cell composition between DMP-777-treated wild-type (WT) and KO mice. The analysis was matched with a published signature file.51 (C) GSEA graphs for SPEM-related immune gene signatures comparing DMP-777-treated KO and WT mice. (D) Immunofluorescence images for F4/80, and CD163 of the Unt, DMP-777 (D7)-treated, and HDT-treated corpus. Scale bars, 100 μm. (E) Number of positives in a 20X high-power field of the Unt, DMP-777 (D7), and HDT groups. Data are presented as a mean ± SEM (n = 3 per group, two-tailed unpaired Student’s t-test, *p < 0.05, **p < 0.01). (F) Immunofluorescence images for WFDC2, and CD163 in adjacent normal (Adj.N), metaplasia, and cancer tissues from human patients. Scale bars, 100 μm. (G) Correlation between WFDC2-positive cells and CD163-positive cells in human tissue. Positive cells in human specimens (n = 27) were measured in a 20X high-power field and assessed by a two-tailed test using Pearson’s correlation coefficients. Unt, Untreated; D7, 7 days of DMP-777 treatment; HDT, high-dose tamoxifen.

