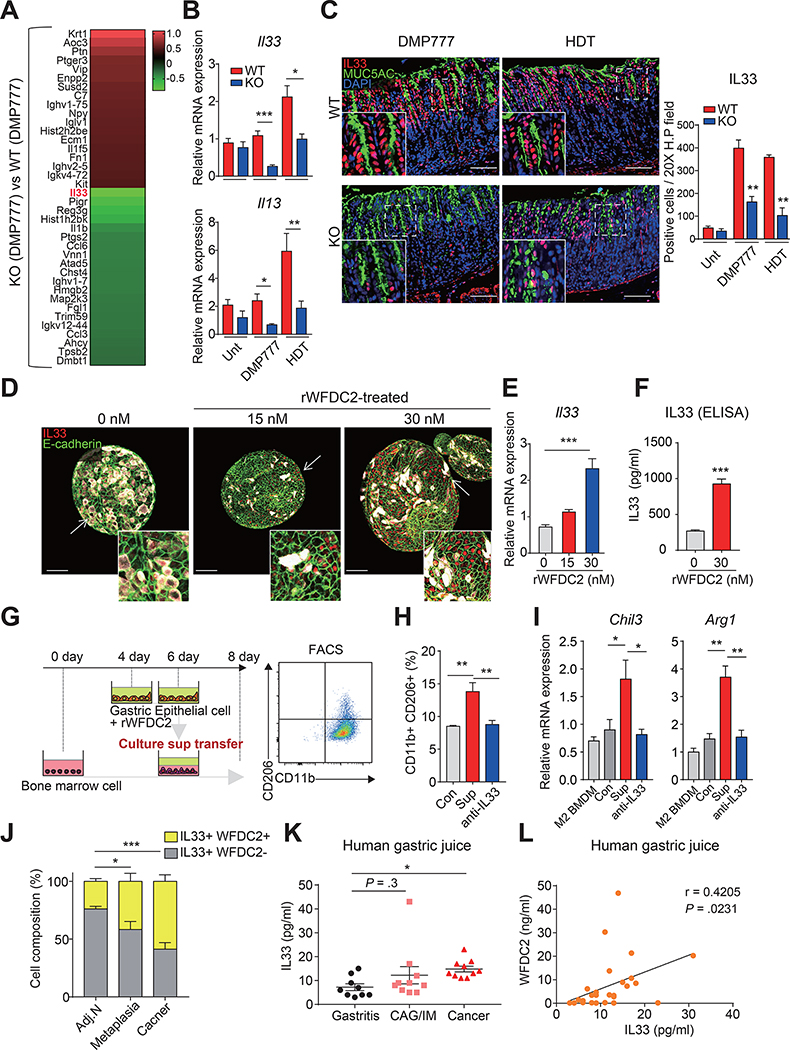
Figure 5. Novel function of WFDC2 as a regulator of interleukin-33 (IL33).
(A) Heatmap showing differentially expressed genes involved in immune-related Gene Ontology terms (GO: 0006955, GO: 0006954) in DMP-777-treated knockout (KO) mice compared to DMP-777-treated wild-type (WT) mice. (B) RT-qPCR for Il33 and Il13 in the Unt, DMP-777 (D7)-treated, and HDT-treated corpus; mRNA expression levels were normalized by Gapdh (n = 3–7 per group, two-tailed unpaired Student’s t-test, *p < 0.05, **p < 0.01, ***p < 0.001). (C) Immunofluorescence for MUC5AC, and IL33 in DMP-777 (D7) and HDT groups. Scale bar, 100 μm. Graph indicates the number of positives at epithelial regions in a 20X high-power field (n = 3 per group, two-tailed unpaired Student’s t-test, **p < 0.01). (D) Immunofluorescence for E-cadherin, MUC5AC and IL33 in rWFDC2-treated corpus organoids at 48 h after initial treatment. Scale bar, 100 μm. (E) RT-qPCR for Il33 in rWFDC2-treated corpus organoids; mRNA expression levels were normalized by Gapdh (n = 3–4 per each group, one-way analysis of variance with Dunnett’s multiple comparison, ***p < 0.001). (F) IL33 level in supernatants from gastric epithelial cells at 48 h after treatment with rWFDC2 (n = 3 per group, two-tailed unpaired Student’s t-test, **p < 0.01). (G–I) BMDMs were cultured for 8 days and supplemented with the supernatant from rWFDC2-treated gastric epithelium after 4 days of culture, and further analyzed with FACS. (H) FACS sorting for CD45+CD11b+CD206+ M2 macrophages and (I) RT-qPCR for M2 macrophage markers (Chil3 and Arg1). M2 BMDM indicates cells without supplement of supernatant as a normal control, while Con indicates cells supplemented with the supernatant of epithelial cells (+0 nM rWFDC2). Sup indicates cells supplemented with the supernatant of epithelial cells (+30 nM rWFDC2), and anti-IL33 indicates Sup (+30 nM rWFDC2) treated with anti-IL33 antibody. (n = 4 per group, one-way analysis of variance with Dunnett’s multiple comparison, *p < 0.05, **p < 0.01). (J) IL33-expressing cell composition (IL33+WFDC2-, IL33+WFDC2+) in a 20X high-power field of adjacent normal (Adj.N, n = 5), metaplasia (n = 8), and cancer (n = 8) tissues from human patients (two-tailed unpaired Student’s t-test, *p < 0.05 ***p < 0.001). (K) IL33 levels in human gastric juice from patients with gastritis (n = 9), chronic atrophic gastritis/intestinal metaplasia (CAG/IM, n = 10), and cancer (n = 10) (two-tailed unpaired Student’s t-test, *p < 0.05). (L) Correlation between IL33 and WFDC2 levels in human gastric juice (n = 29) assessed by a two-tailed test using Pearson’s correlation coefficients. All data are presented as a mean ± SEM. Unt, Untreated; D7, 7 days of DMP-777 treatment; HDT, high-dose tamoxifen.

