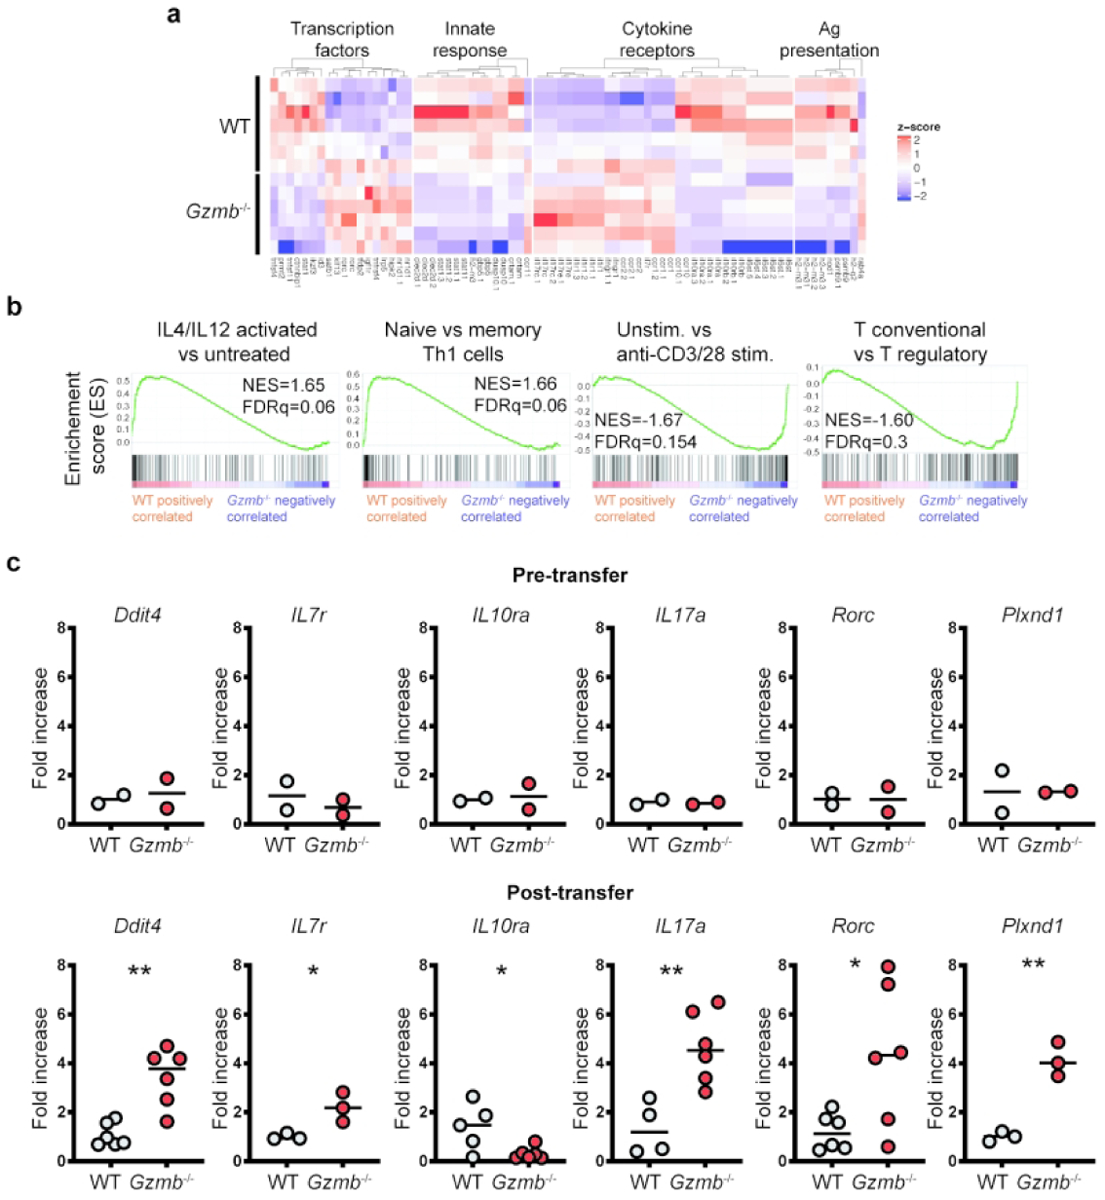
Figure 4.

Granzyme B-deficient CD4+ T cells activated in vivo display a distinct gene expression profile. 1×10⁵ CD4+CD45RBhi T cells from WT or Gzmb−/− donor mice were adoptively transferred into Rag2−/− recipient mice. Three weeks after transfer, donor-derived cells were recovered from the MLN, sorted for live TCRβ+CD4+, their RNA isolated and sequenced. (a) Representative heat map. (b) Representative gene set enrichment analysis. The green line on the plots indicate the enrichment score; the black lines show where the genes related to the pathway are located in the ranking; the legend at the bottom indicates whether the expression of the genes correlate more with CD4+ T cells derived from WT or Gzmb−/− mice. (c) Real-time PCR validation of selected genes. For day 0, n=2; for day 21, n=3–6. *P<0.05; **P<0.01. Student’s t-Test.
