
Figure 4.
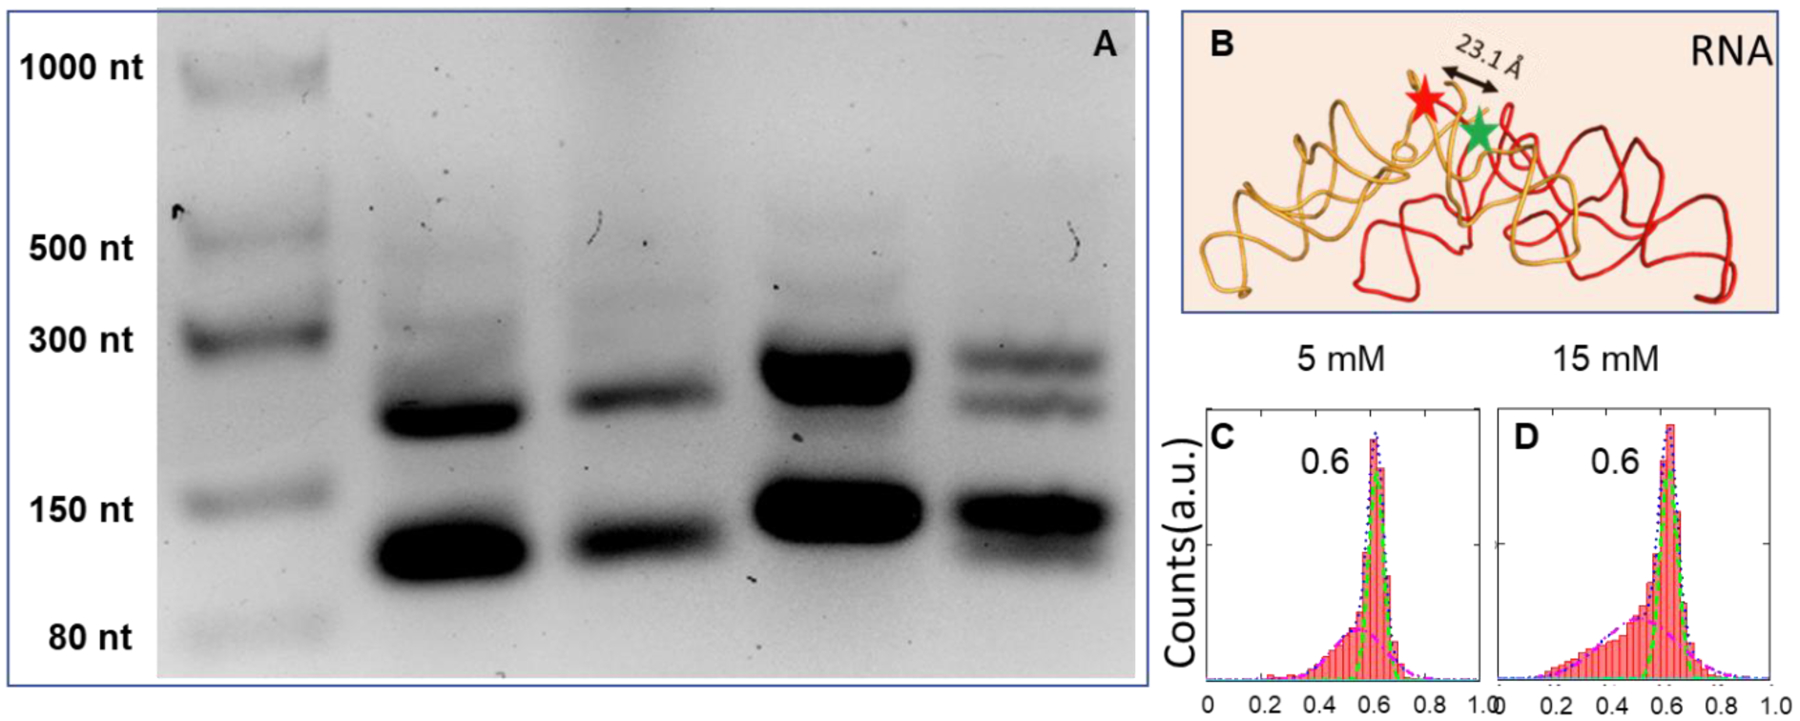
Agarose native gel (stained with SYBR™Gold) and FRET measurement of RNA dimers. (A) Lane 1: single strand RNA ladder; Lane 2 and 3: PTC1b (100 and 200 ng); Lane 4: PTC1a (200 ng); Lane 5: PTC1a/b (100ng/100ng). (B) FRET efficiency histograms between the RNA molecules. The green and red starts showed the Cy3 and Cy5 labeling positions, respectively. (C) and (D) Similar FRET efficiency histograms were observed with 5 and 15 mM Mg2+.