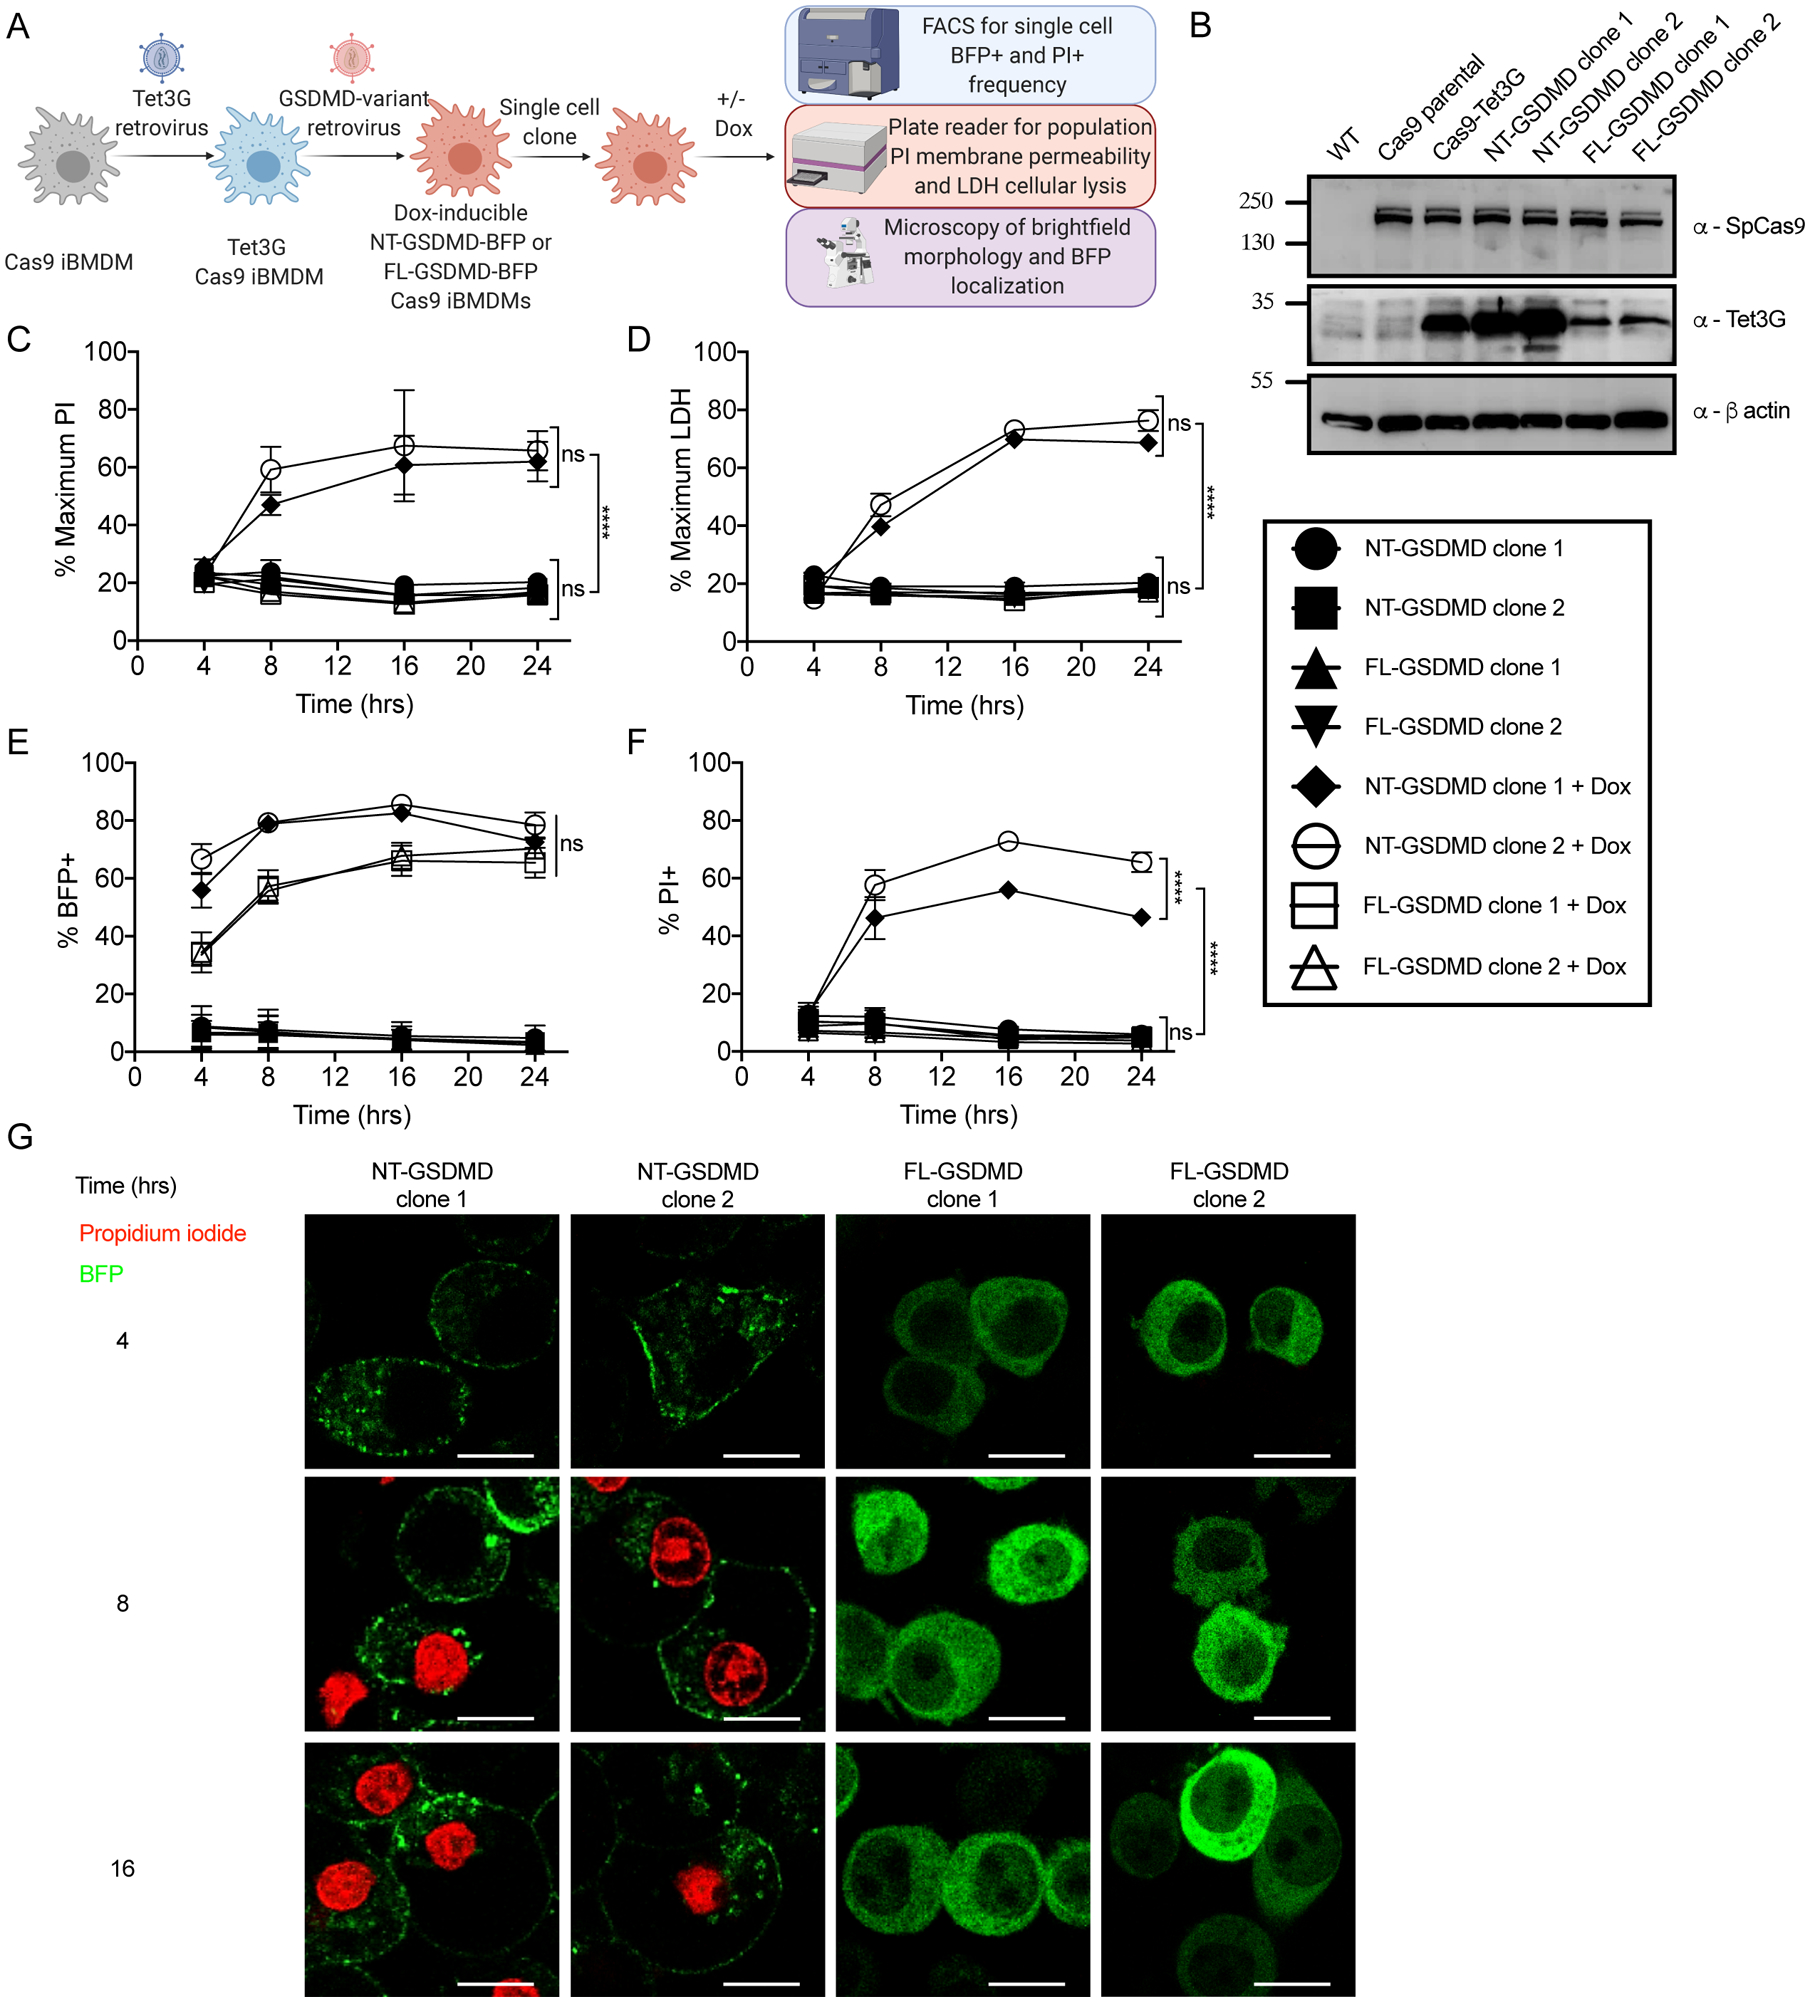
Figure 1. Engineered macrophages model pyroptosis through expression of the GSDMD N-terminal domain.

(A) Retroviral transduction workflow to generate Tet3G transactivator expressing Dox-inducible fluorescently tagged variants of GSDMD in iBMDMs from the Cas9 knock-in mouse and downstream characterization.
(B) Western blot of stable Cas9 expression in parental and progeny iBMDMs and stable expression of Tet3G transactivator in progeny iBMDM clones with β-actin loading control.
(C) Kinetic analysis of PI uptake by plate reader to measure bulk membrane permeability in populations of uninduced or Dox-induced (0.5 μg/ml) cells expressing NT-GSDMD-BFP or FL-GSDMD-BFP.
(D) Time course end point analysis of LDH release into cell free supernatants to measure cell lysis in populations of uninduced or Dox-induced (0.5 μg/ml) cells expressing NT-GSDMD-BFP or FL-GSDMD-BFP.
(E, F) Time course end point analysis by flow cytometry of the frequency of BFP+ (E) or PI+ cells (F) using uninduced or Dox-induced (0.5 μg/ml) cells expressing NT-GSDMD-BFP or FL-GSDMD-BFP.
(G) Time course live cell imaging of Dox-induced cells expressing NT-GSDMD-BFP or FL-GSDMD-BFP noting localization of BFP signal and PI uptake. Scale bar indicates 10 μm.
All quantification represents the mean and SEM of three independent experiments. Two-way ANOVA was used for analysis. See also Figure S1.
