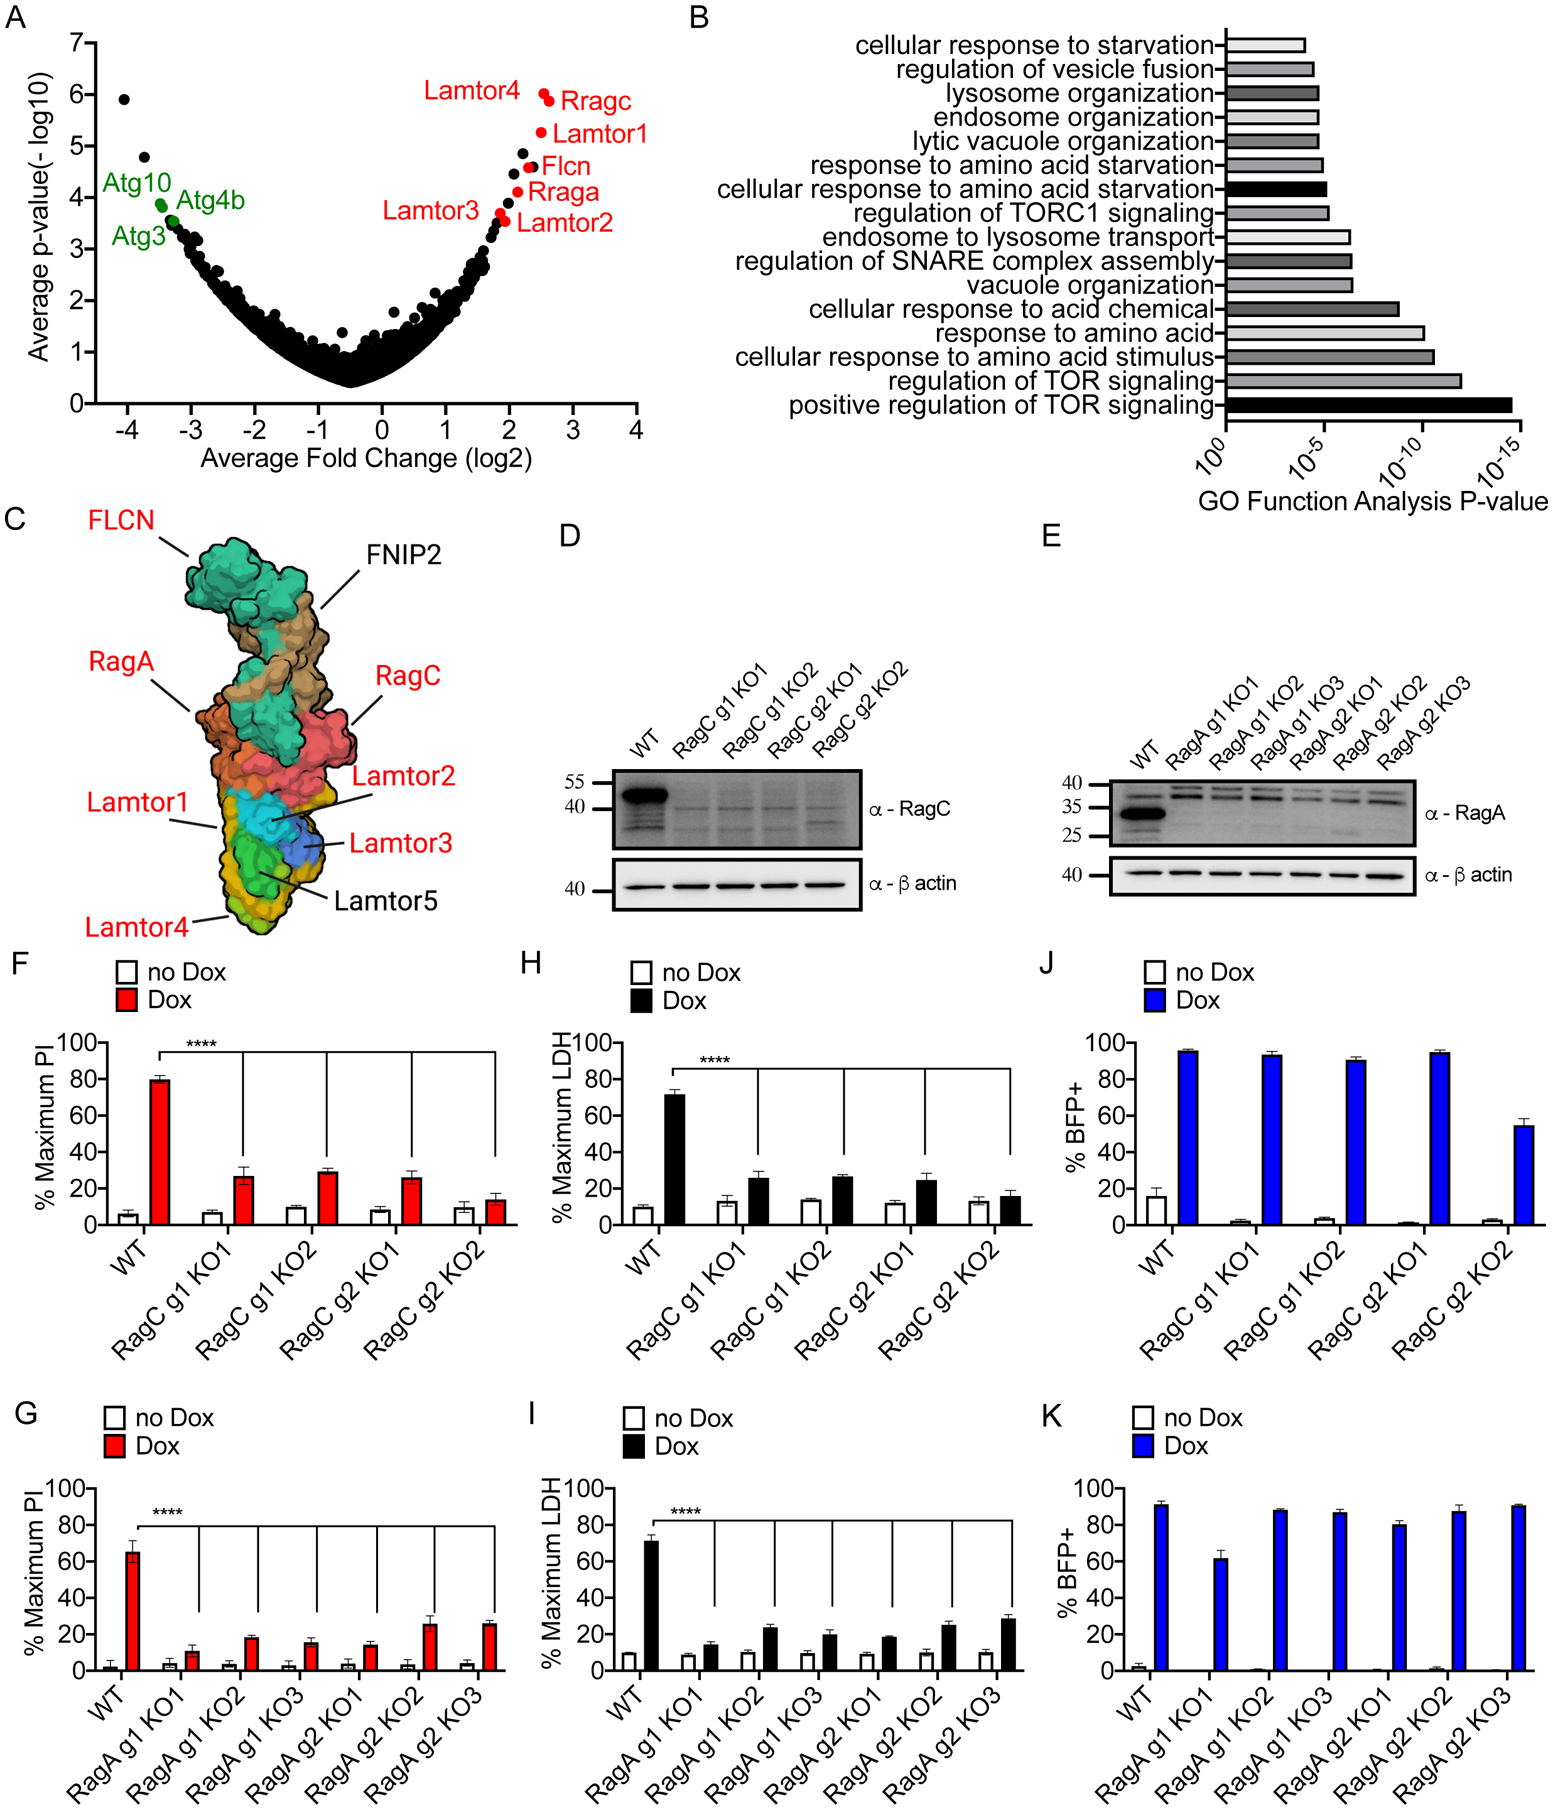
Figure 2. Analysis of survivor cells sgRNA enrichment and validation of screen hits.

(A) Hypergeometric analysis of log-normalized guide abundance of survivor cells subtracted by the log-normalized abundance of input cells plotted as gene level average p-value versus gene level average LFC.
(B) Gene ontology functional annotation enrichment analysis for ranked hit list using GOrilla web analysis tool.
(C) Cryo-EM structure of the Ragulator-Rag complex cartoon schematic with top hits identified from CRISPR screen highlighted in red.
(D, E) Western blot of RagC (D) or RagA (E) protein ablation comparing empty vector transduced or cells expressing sgRNA guides targeting RagC and RagA.
(F, G) PI uptake analysis of cells of the genotypes indicated, left uninduced or Dox-induced (2 μg/ml) for 16 hours.
(H, I) LDH release from cells of the genotypes indicated, left uninduced or Dox-induced (2 μg/ml) for 16 hours.
(J, K) Frequency of BFP+ cells by flow cytometry of cells of the genotypes indicated, left uninduced or Dox-induced (2 μg/ml) for 16 hours.
All quantification represents the mean and SEM of three independent experiments. Two-way ANOVA was used for analysis. See also Figure S2.
