
FIGURE 4.
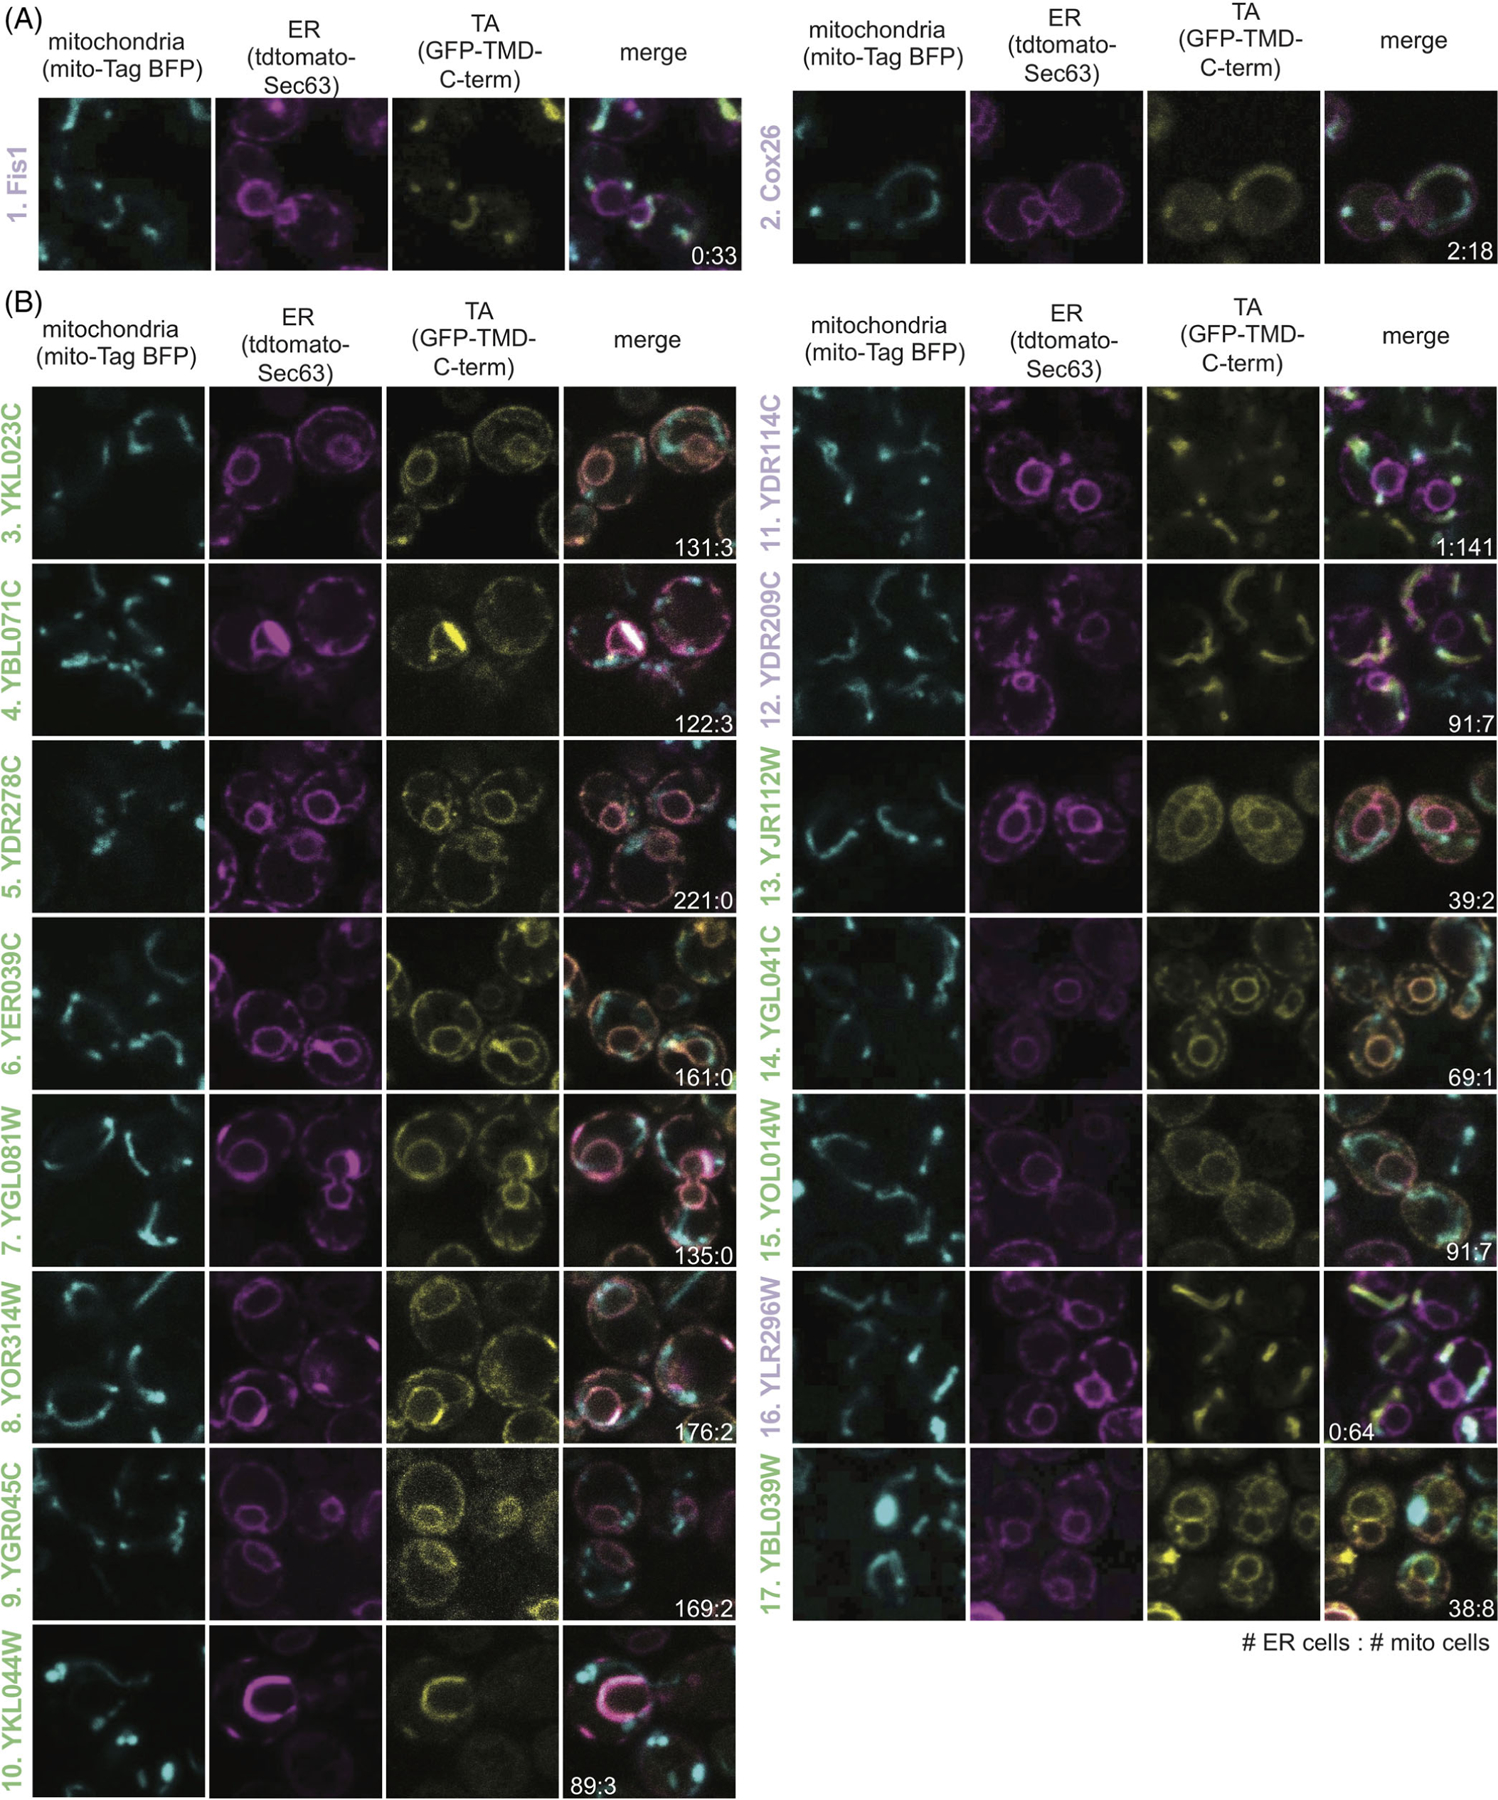
Localization of unknown yeast TA proteins. The ER (magenta panel) and mitochondria (cyan panel) were labeled with tdTomato and BFP, respectively. TA protein localization was visualized by GFP (yellow panel) and colocalization was determined by overlap (merge panel). The ratio of the number of cells with the TA protein localizing to the ER vs the mitochondria are noted in the merge image. Numbered as in Figure 3D with labels colored based on their determined localizations: ER (green) and mitochondria (purple). TA proteins include (A) two mitochondrial TA proteins with known localizations and (B) 15 with unknown localizations