
Figure 4. Mutation spectra for 5-aza-C- or vehicle-treated viruses.
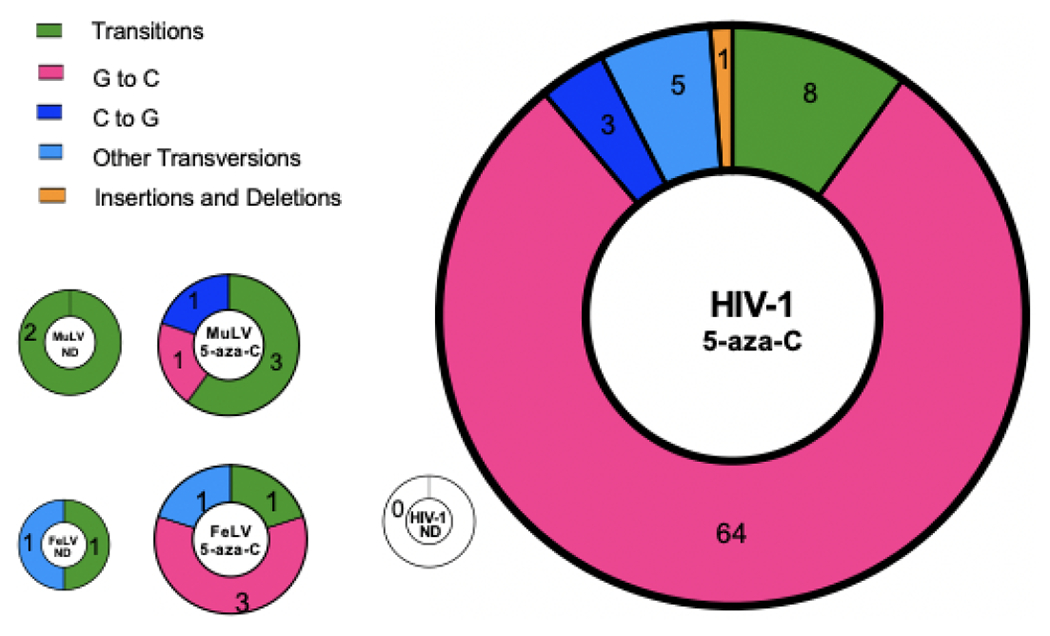
The frequency of each type of mutation is expressed as a percentage of total mutations. The area of each pie chart is sized according to total mutation frequency; HIV-1 ND pie chart is sized to the upper limit of its mutation frequency. Total numbers of each mutation type are indicated in each slice.