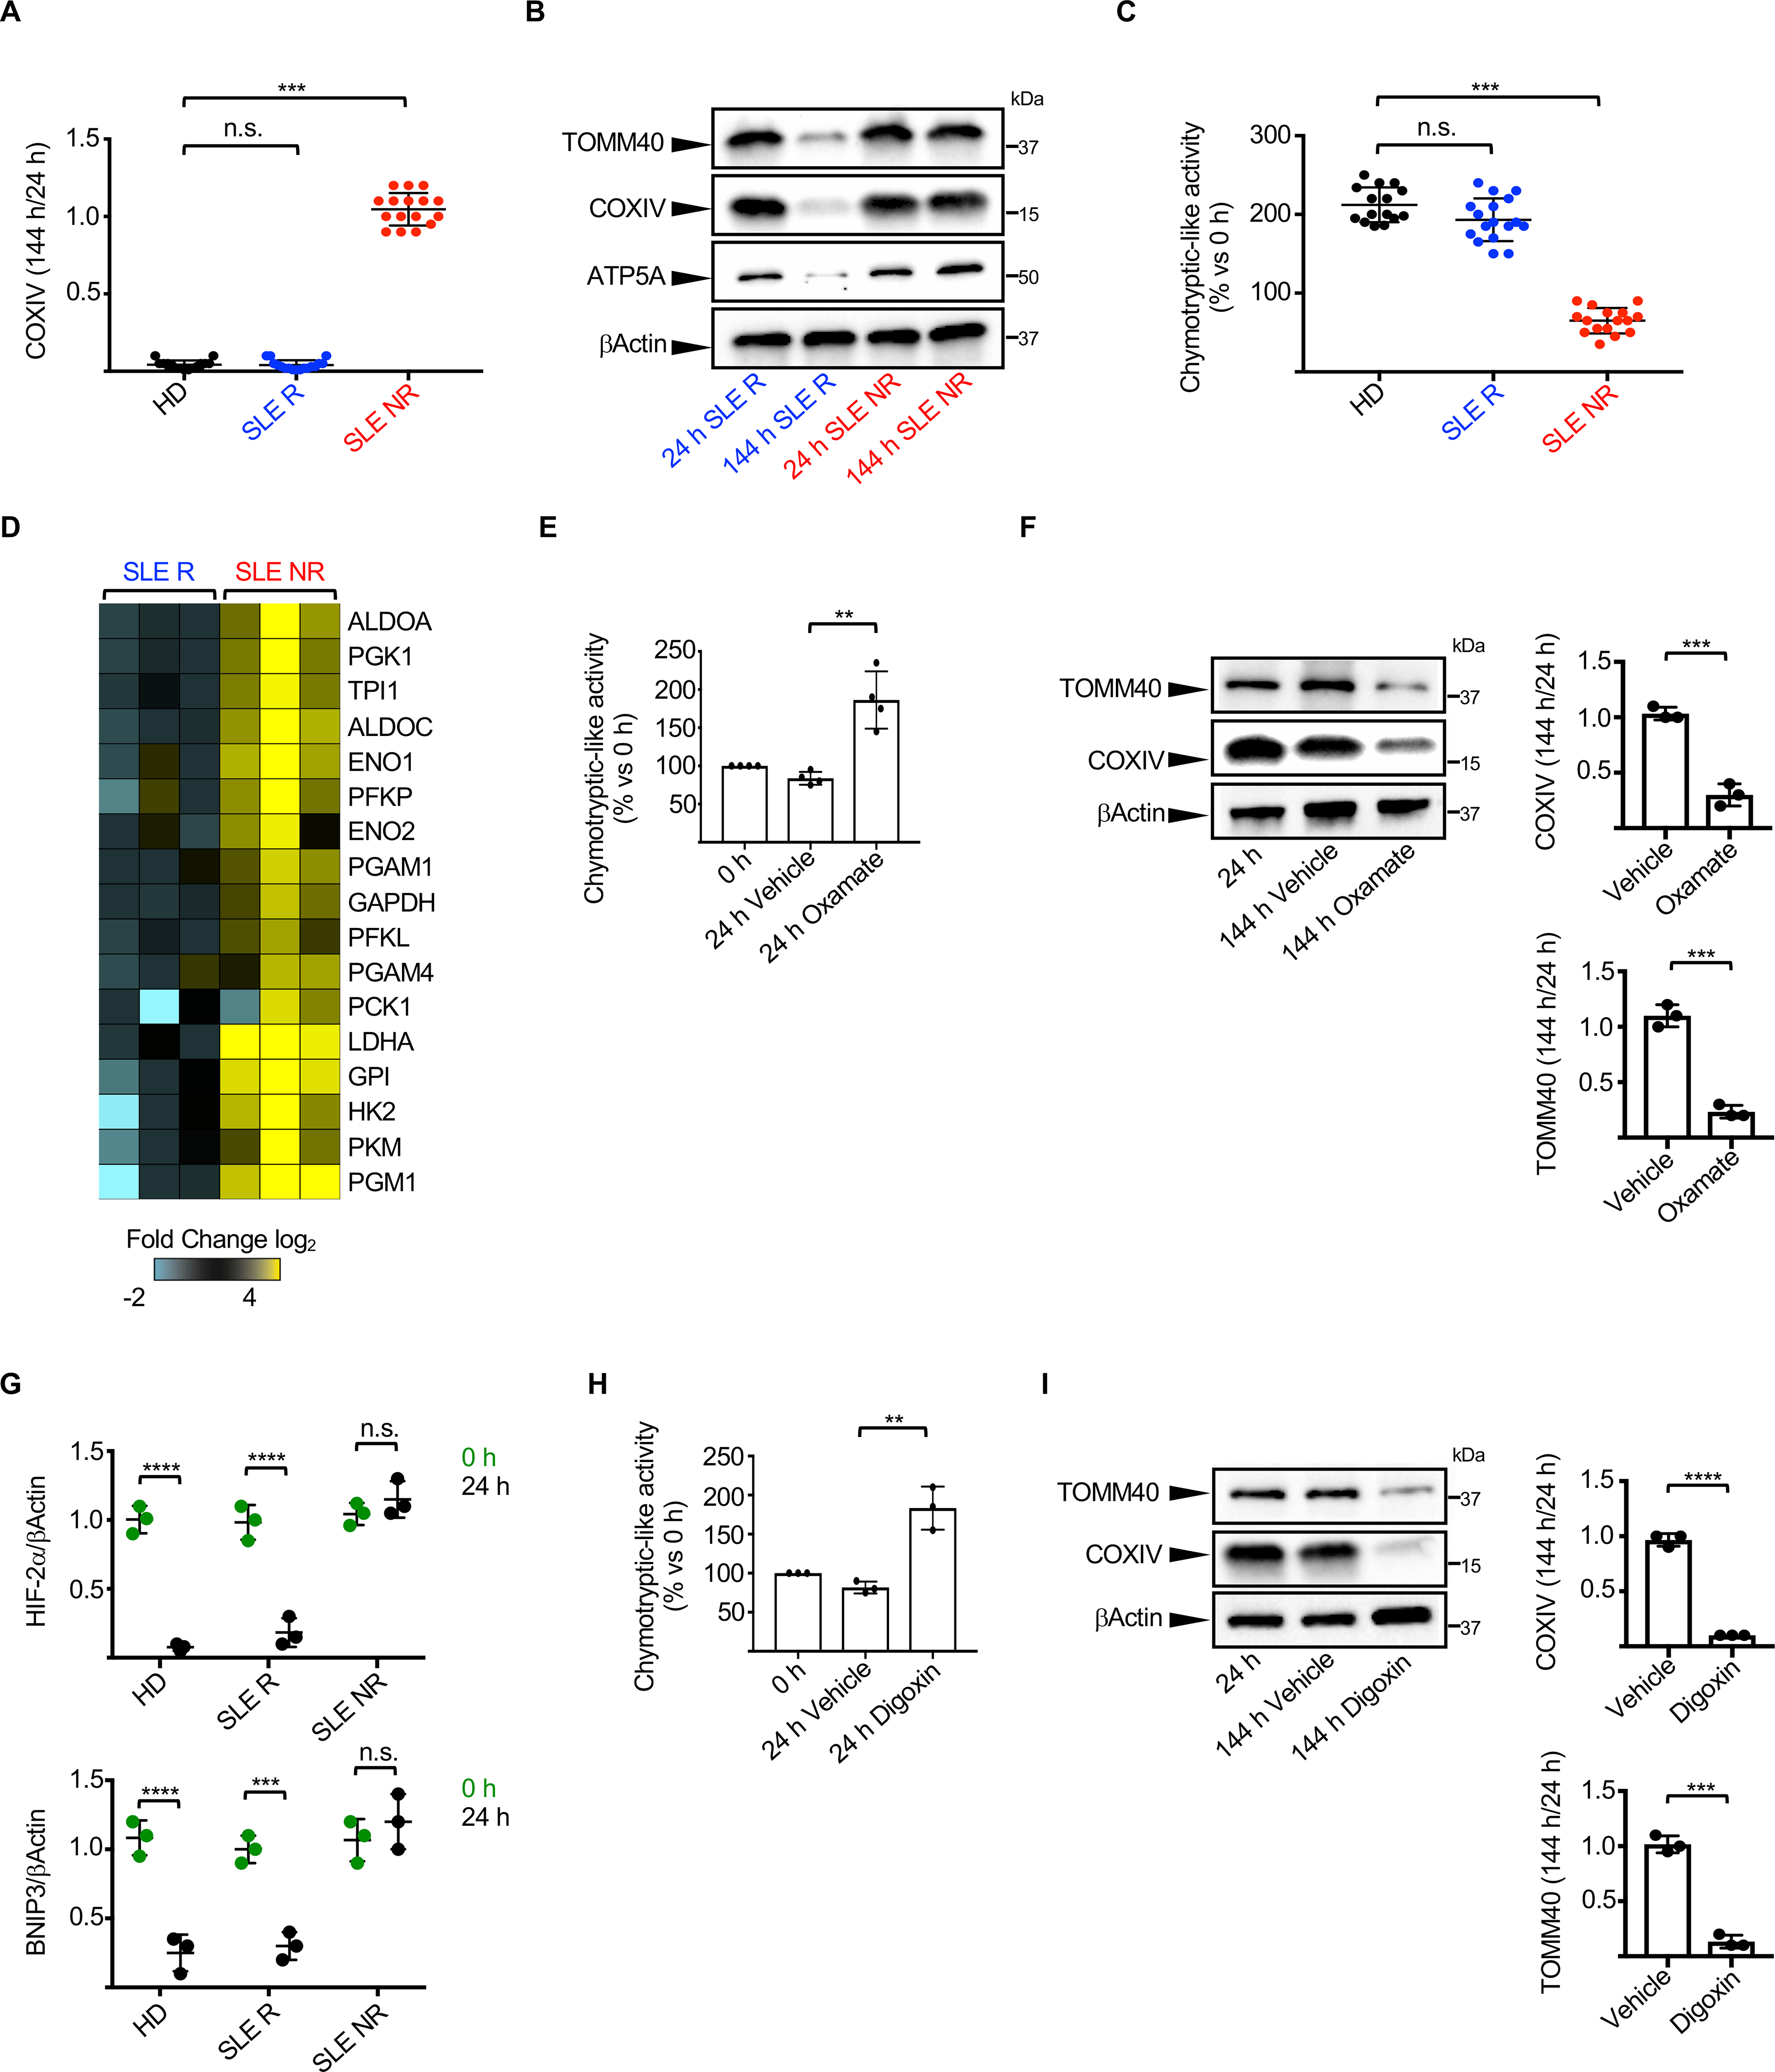
Figure 5. Impaired HIF-2α-mediated metabolic switch and UPS activation in SLE erythroblasts.

(A) Ratio of COXIV levels in HD (n=15), SLE Removers (R; n=17) and SLE Non-Removers (NR; n=16) proerythroblasts 144 h and 24 h post-differentiation. (HD – Healthy donor). (B) Representative Western blot analysis of selected mitochondrial proteins in proerythroblasts from one representative SLE R and one representative NR 24 h and 144 h post-differentiation. (C) Relative chymotrypsin-like UPS activity in HD (n=15), SLE R (n=17) and SLE NR (n=16) proerythroblasts 24 h post-differentiation. (D) Differential gene expression analysis between SLE R (n=3) and NR (n=3) of selected genes involved in the glycolytic and gluconeogenesis pathways. Data are normalized to SLE R. Relative chymotrypsin-like UPS activity (E, n=4) and levels of selected mitochondrial proteins (F, n=3) in SLE NR proerythroblasts differentiated in the presence or absence of Sodium Oxamate. (G) Quantification of HIF-2α and BNIP3 protein levels in SLE R and NR proerythroblasts. Data are normalized to βActin. (n=3). Relative chymotrypsin-like UPS activity (H) and levels of selected mitochondrial proteins (I) in SLE NR proerythroblasts differentiated in the presence or absence of Digoxin. (n=3). In (B, F and I) results are representative of at least three independent experiments. Data are means ± SEM. [One-way analysis of variance (ANOVA) with Tukey post hoc test for multiple comparisons in (A) and (C); Two-tailed unpaired Student t test in (E), (F), (G), (H) and (I)].
