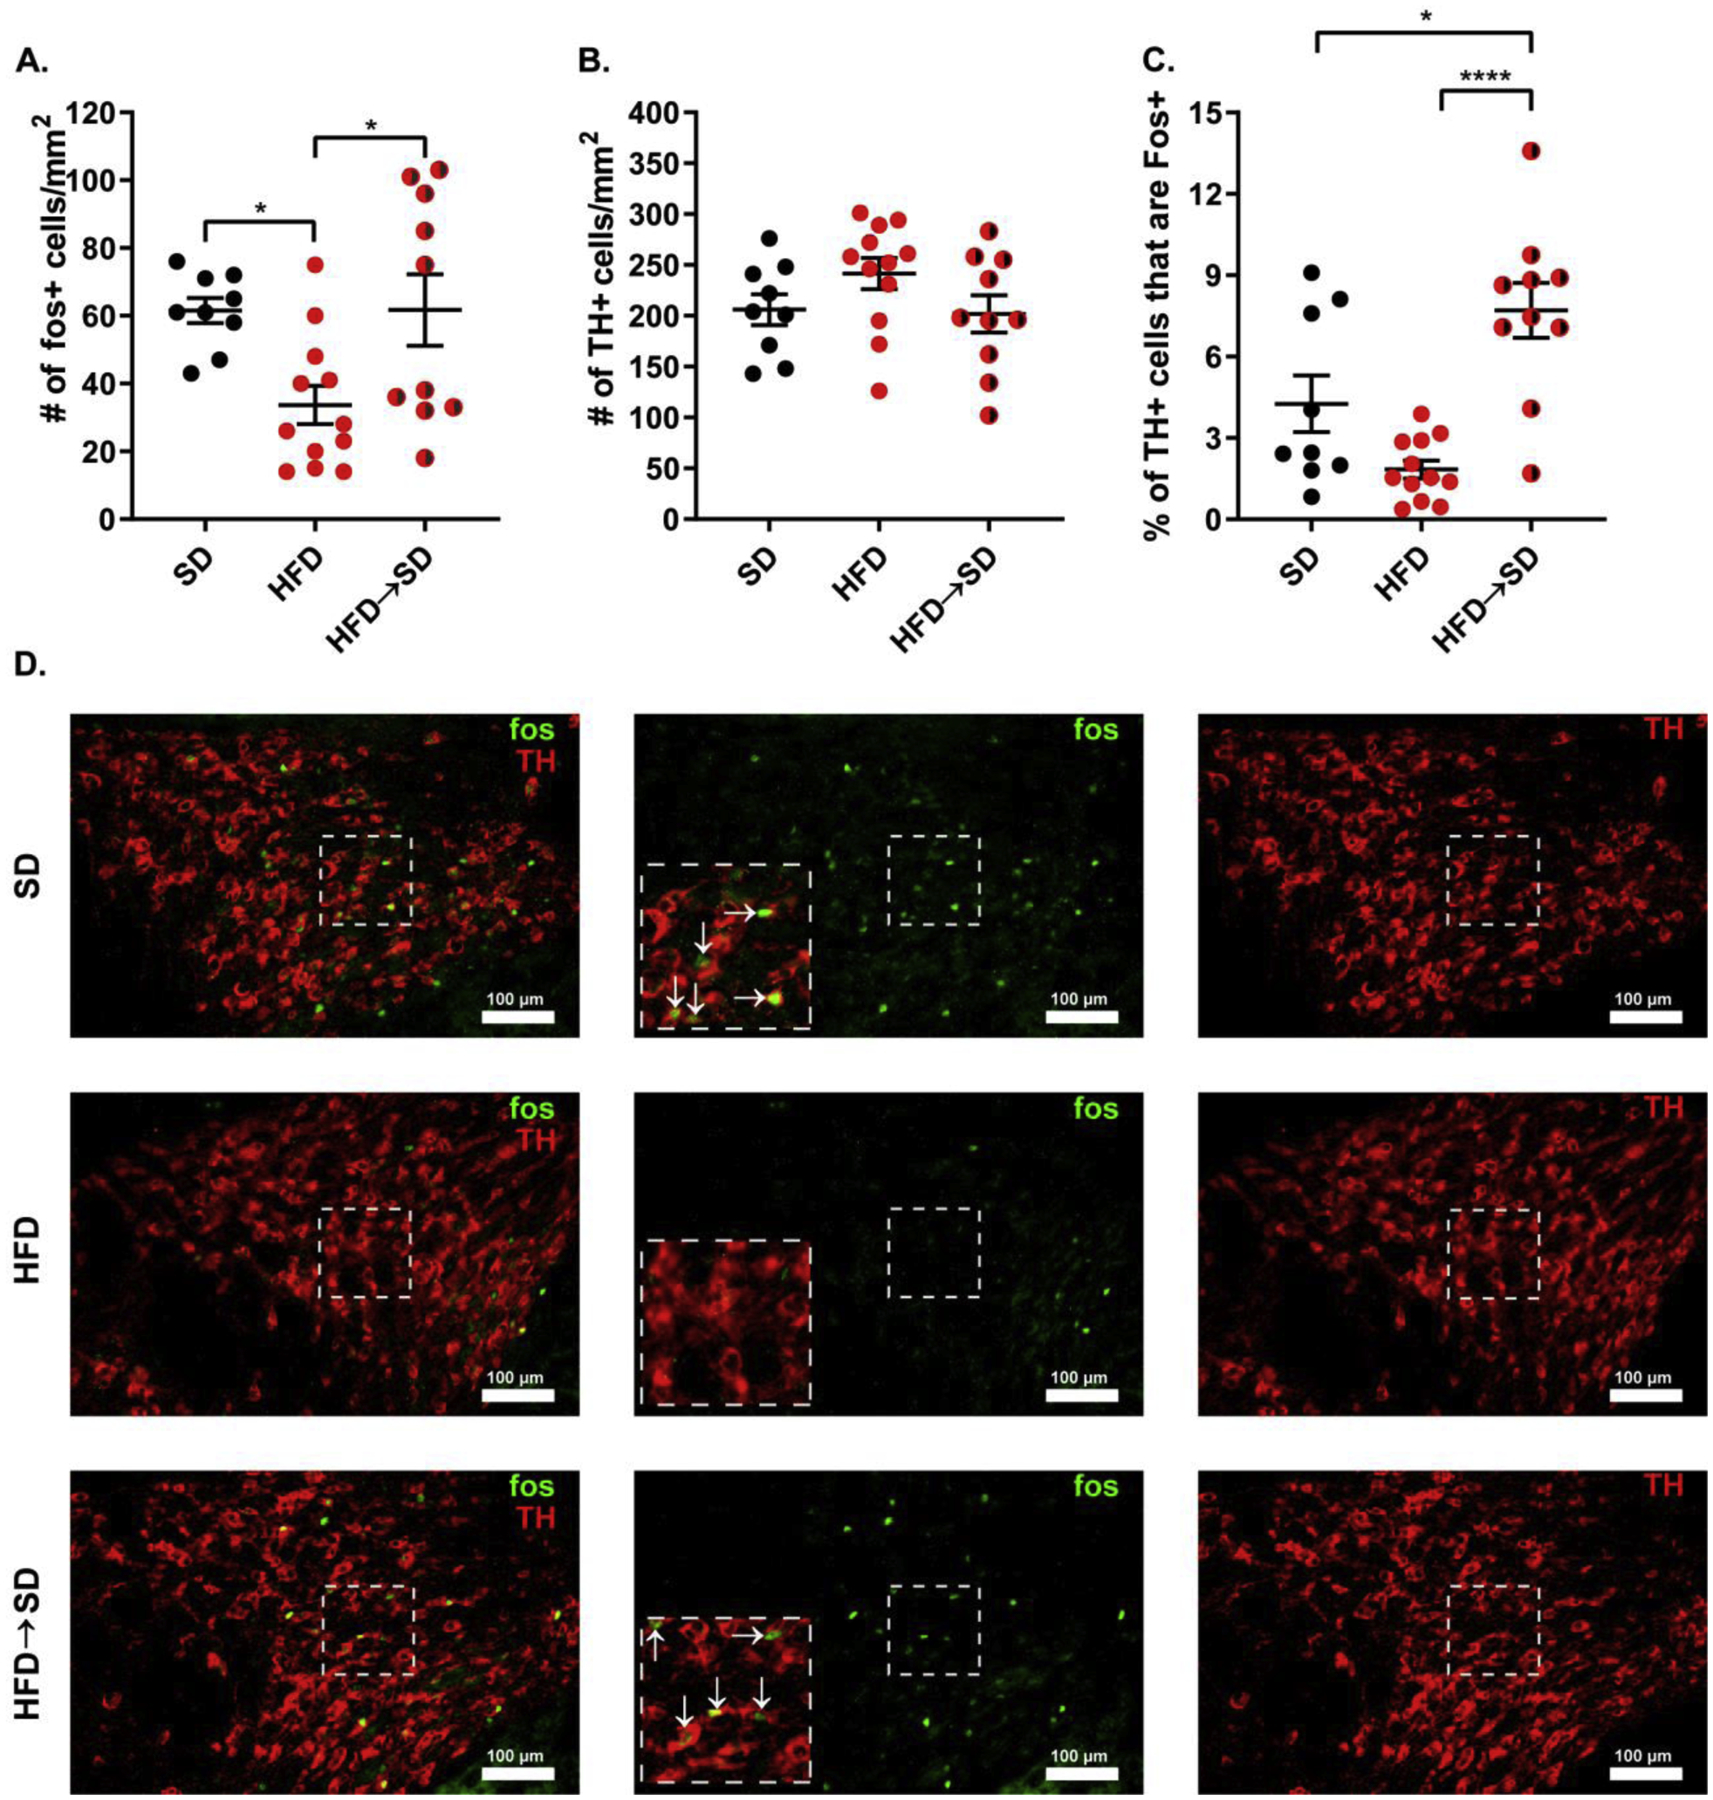
Fig.4.

Prolonged HFD consumption leads to a failure of the VTA to respond to a novel food reward. (A) Total number of VTA c-Fos positive cells. One-way ANOVA with Bonferroni post-hoc comparison; n=9–12/group; F(2,28)=5.302; p=0.0111. (B) Total number of VTA TH positive cells. One-way ANOVA with Bonferroni post-hoc comparison; n=9–12/group; F(2,28)=1.892; p= 0.1696. (C) Percentage of VTA TH positive cells that are also c-Fos positive. One-way ANOVA with Bonferroni post-hoc comparison; n=9–12/group; F(2,28)=14.18; p <0.0001. (D) Representative images of VTA sections stained for c-Fos and TH. Dashed boxes represent corresponding areas of the same section. Arrows indicate c-Fos immunoreactivity. Data are represented as mean ± SEM. *p<0.05; ****p < 0.0001. See also Supplemental Figure 6.
