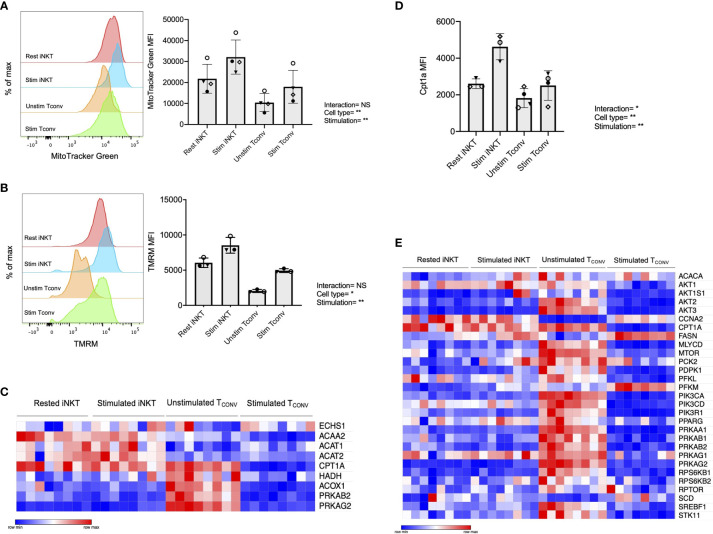
Figure 4.
Human iNKT cells possess enhanced mitochondrial metabolism and FAO relative to TCONV. (A) Histograms (left) displaying mean fluorescence intensity (MFI) of MitoTracker Green emission (FITC channel) in purified rested and stimulated iNKT cells and TCONV from n=3 matching human donor biological replicates run in independent experiments (Right) Bar graphs of MFIs. Symbols represent independent, matched human donors. (B) Histograms (left) displaying mean fluorescence intensity (MFI) of TMRM emission (PE channel) in purified rested and stimulated iNKT cells and TCONV from n=3 matching human donor biological replicates run in independent experiments. (Right) Bar graphs of MFIs. Symbols represent independent, matched human donors. (C) Heatmap of n=8 independent biological replicates of matched healthy human donor rested and stimulated iNKT cells and TCONV (processed per schematic in Supplementary Figure 1) relative expression of fatty acid oxidation (FAO) pathway genes in NanoString nCounter Human Metabolic Pathways probe set. Genes with counts under 100 were eliminated from analysis. Coloring indicates relative expression of each gene, from low (blue) to high (red). Heatmap generated on Morpheus. (D) Purified rested and stimulated human iNKT cells and TCONV were stained for intracellular Cpt1a expression after 48 hours. Mean fluorescence intensity (MFI) of Cpt1a (left) and percentage of Cpt1a positive cells (right) for each cell type relative to isotype control indicated. Each symbol represents matched healthy human donor sample; each biological replicate set of cells was run in independent experiments. (E) Heatmap of n=8 independent biological replicates of matched healthy human donor rested and stimulated iNKT and TCONV relative expression of AMPK pathway genes in NanoString nCounter Human Metabolic Pathways probe set analyzed as in (C). For studies comparing mean fluorescence intensity values (A, B, D), statistical significance between groups (NS, non-significant; *p < 0.05, **p < 0.01) was determined by two-way ANOVA tests and indicated on the bottom of each graph. For NanoString data in (C, E), each set of matched donor biological replicates was independently collected, stimulated, and harvested for mRNA and all samples were run and analyzed on NanoString together.

