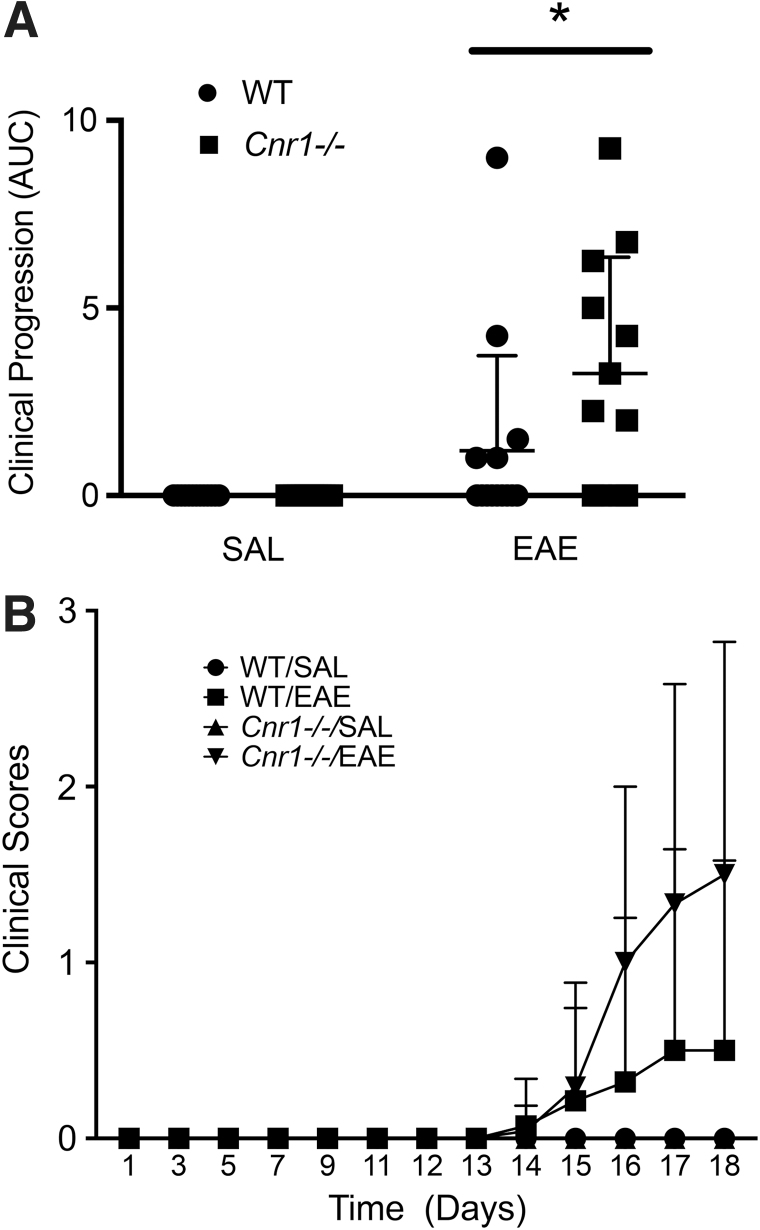
FIG. 2.
Differences in clinical EAE between Cnr1−/− and WT littermates. Clinical scores for WT/SAL (n=13), WT/EAE (n=14), Cnr1−/−/SAL (n=13), and Cnr1−/−/EAE (n=12) mice were recorded over the 18-day timecourse of disease. Average AUC was then calculated for each experimental group and analyzed using a two-way ANOVA followed by Sidak's post hoc test (A). The clinical scores were also graphed over time to show clinical progression for each group (B). Analysis of the average AUC for disease progression of each group showed a statistically significant difference between the Cnr1−/−/EAE mice and WT mice. Error bars represent the SD for each group (only top error bars are shown). *p<0.05 difference between WT and Cnr1−/− in EAE. ANOVA, analysis of variance; AUC, area under the curve.

