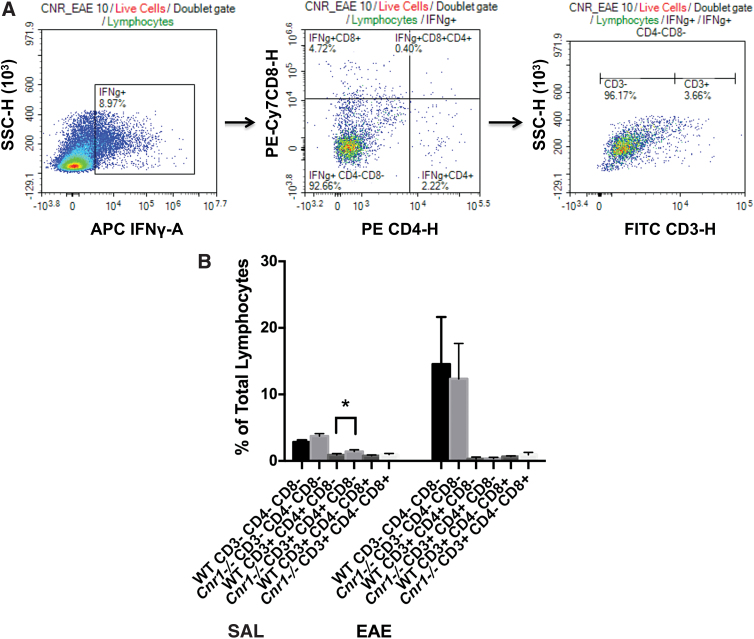
FIG. 6.
Analysis of IFN-γ production in MOG35–55-restimulated splenocytes by flow cytometry. IFN-γ production was analyzed by flow cytometry in the ex vivo MOG35–55-restimulated splenocytes of WT/SAL (n=5), WT/EAE (n=6), Cnr1−/−/SAL (n=5), and Cnr1−/−/EAE (n=5) mice. IFN-γ producing cells were subdivided based on their CD4, CD8, and CD3 expression by first isolating IFN-γ producing lymphocytes, then determining the expression of CD4 and CD8 on these cells, and finally determining the expression of CD3 within the T cell subpopulations (A). Analysis of various cell types revealed no significant differences between Cnr1−/−/EAE and WT/EAE mice. A significantly higher percentage of CD3+CD4+CD8− cells was seen in Cnr1−/−/SAL mice compared with WT/SAL mice. In addition, in these experiments, CD3− cells appear to be the predominant source of IFN-γ (B). Statistical analysis was performed using two-way ANOVA followed by Sidak's post hoc test. Bars represent the mean±SD for each group of mice. *p<0.05 difference between WT and Cnr1−/−. Color images are available online.

