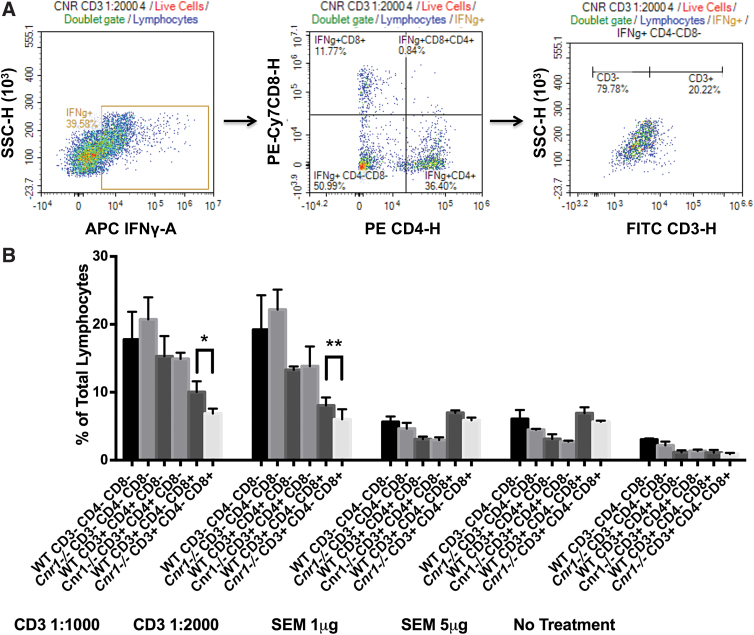
FIG. 7.
Analysis of IFN-γ production in anti-CD3/anti-CD28- and SEM-stimulated splenocytes by flow cytometry. IFN-γ production was analyzed by flow cytometry after anti-CD3/anti-CD28 antibody or SEM stimulation of splenocytes from female Cnr1−/− and WT mice. IFN-γ producing cells were subdivided based on their CD4, CD8, and CD3 expression by first isolating IFN-γ producing lymphocytes, then determining the expression of CD4 and CD8 on these cells, and finally determining the expression of CD3 within these subpopulations (A). Graph (B) represents the percentages of IFN-γ producing cells obtained after an in vitro 3-day stimulation of naive splenocytes from a female mouse (this can be used for comparison with the ex vivo 3-day restimulation of splenocytes from the female EAE mice in Fig. 6B). Analysis of various cell types from these stimulations revealed a significantly lower percentage of CD3+CD4−CD8+IFN-γ+ cells in Cnr1−/− compared with WT mice when splenocytes were stimulated with anti-CD3/anti-CD28 antibodies. In addition, in these experiments, CD3+ cells appear to be the predominant source of IFN-γ. Statistical analysis was performed using two-way ANOVA followed by Sidak's post hoc test. Bars are mean±SD from quadruplicate wells of one female experiment. *p<0.05, **p<0.01 differences between WT and Cnr1−/−. Color images are available online.

