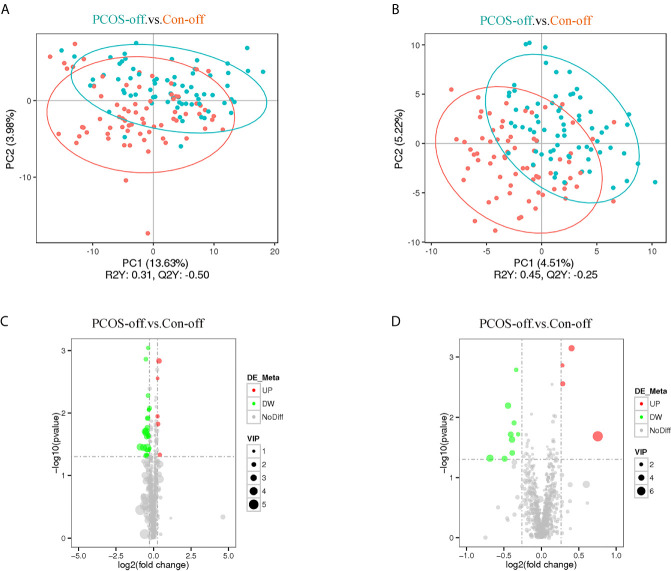
Figure 1.
Plasma lipid profiles of the general offspring born to PCOS women (nPCOS-off =70) or healthy control women (nCon-off =71). (A, B) PLS-DA scores plot established the relationship model between the metabolite expression and the sample category, which indicated different metabolites profile between PCOS-off and Con-off in the positive (A) and negative (B) polarity modes. (C, D) Volcano plot of p values and fold change between PCOS-off and Con-off summarized the distribution of the differential lipids in the positive (C) and negative (D) polarity modes. P value was calculated using student t tests; VIP value represents variable importance in the projection value from PLS-DA model. Red, green, and gray dots represent metabolites with up-regulation, down-regulation, or no difference between study groups, respectively. PCOS-off, offspring born to PCOS women; Con-off, offspring of the control group.

