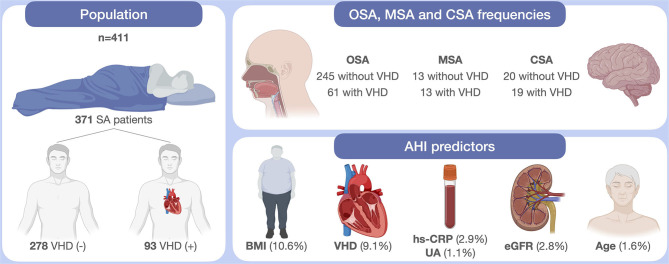
Figure 2.
Schematic illustration of study findings. SA, sleep apnea; VHD, valvular heart disease; OSA, obstructive sleep apnea; MSA, mixed sleep apnea; CSA, central sleep apnea; AHI, apnea hypopnea index; BMI, body mass index; hs-CRP, high-sensitivity C-reactive protein; UA, uric acid; eGFR, estimated Glomerular Filtration Rate. This original figure was created by the authors using “BioRender.com.”

