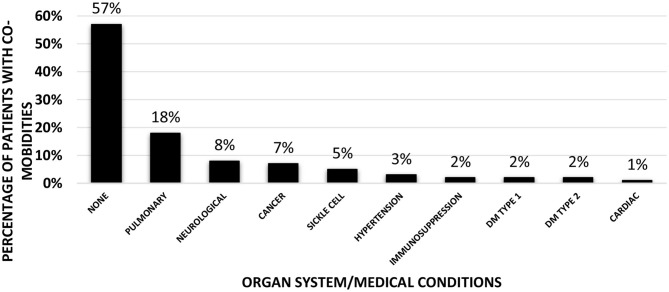
Figure 1.
Co-morbidities of the patients in the entire cohort (n = 92). Bar graph showing percentages of patients with various underlying co-morbidities according to the organ system (Pulmonary/Neurological/Cardiac) or specific medical conditions (Cancer/Sickle cell anemia/Hypertension/Immunosuppression/Type 1 or 2 Diabetes Mellitus).

