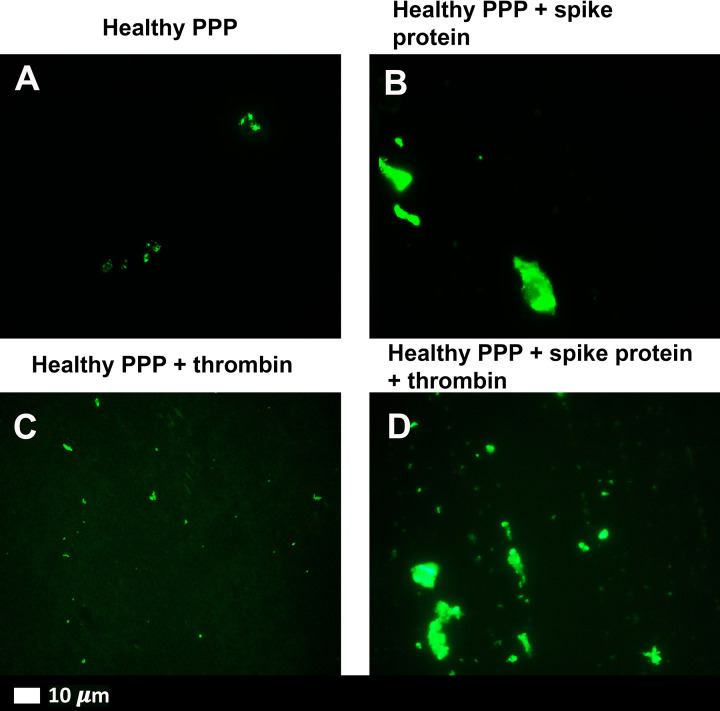
Figure 4. Representative fluorescence micrographs of PPP from healthy individuals after addition of ThT (green fluorescent signal).
(A) PPP smear. (B) PPP with spike protein. (C) PPP with thrombin to create extensive fibrin clot. (D) PPP exposed to spike protein followed by addition of thrombin. Final spike protein concentration was 1 ng.ml−1.

