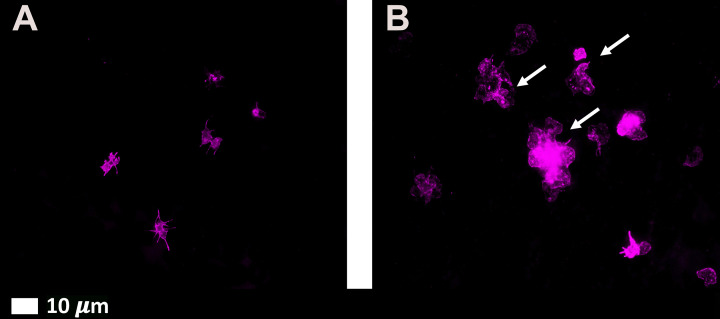
Figure 5. Fluorescence microscopy micrographs of platelets, before and after exposure to spike protein.
(A) Representative platelets from hematocrit incubated with fluorescent marker, CD62P-PE. (B) Representative micrographs showing activated platelets after exposure to spike protein. The white arrows point to hyperactivated activated platelets. White arrows show hyperactivated platelets clumping together.

