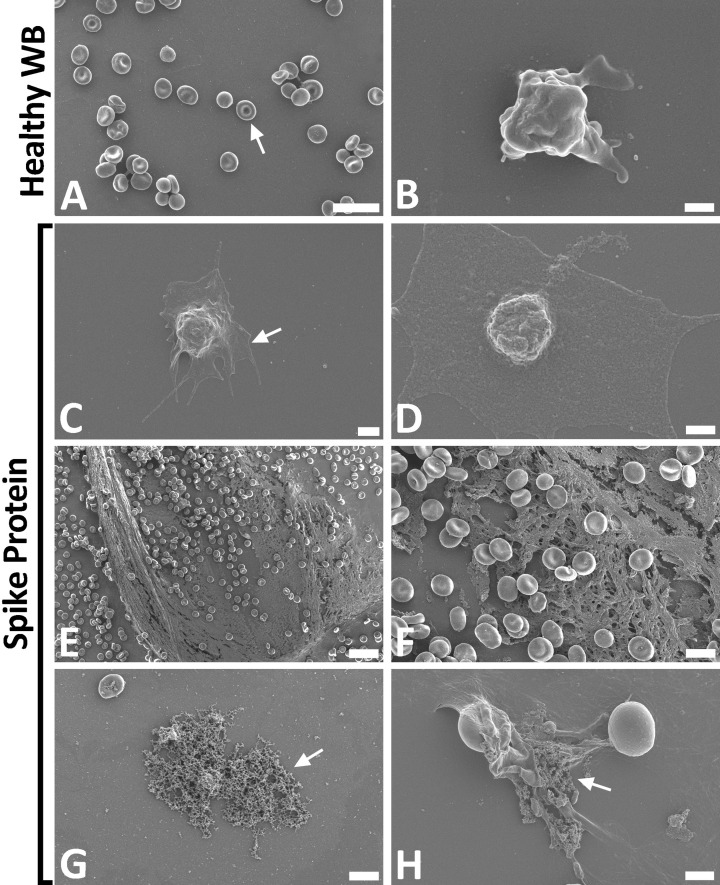
Figure 6. Whole blood sample of healthy volunteers, before and after exposure to spike protein.
(A–H) Representative scanning electron micrographs of healthy control WB, with and without spike protein. (A,B) Healthy WB smears, with arrow indicating normal erythrocyte ultrastructure. (C–H) Healthy WB exposed to spike protein (1 ng.ml−1 final concentration), with (C,D) indicating the activated platelets (arrow), (E,F) showing the spontaneously formed fibrin network and (G,H) the anomalous deposits that is amyloid in nature (arrows) (scale bars: (E) 20 µm; (A) 10 µm; (F,G) 5 µm; (H) 2 µm; (C) 1 µm; (B,D) 500 nm).

