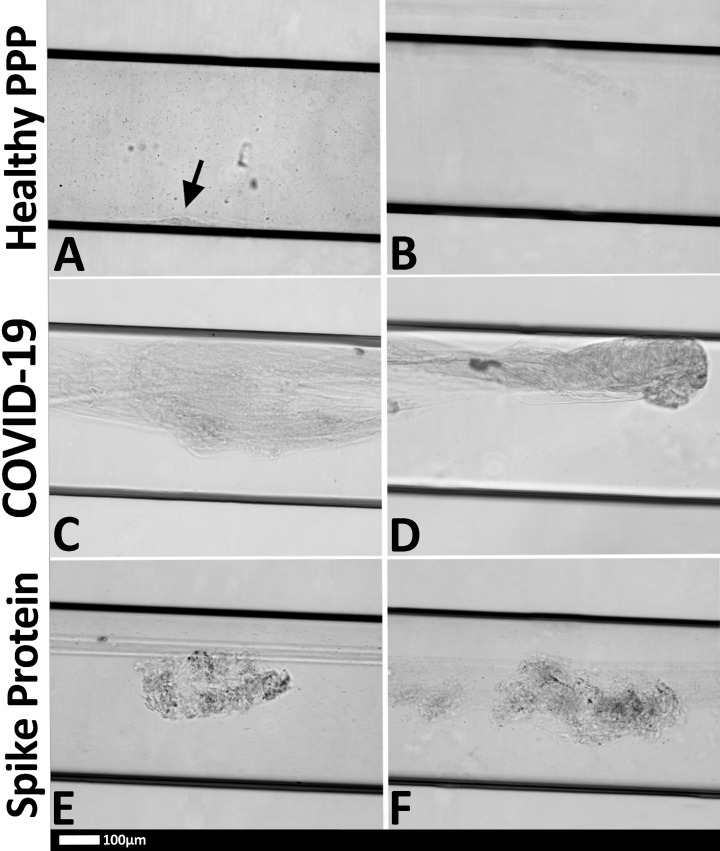
Figure 7. Representative micrographs of PPP clots in the microfluidic chambers (black horizontal lines are the outlines of the chambers) that were coated with thrombin.
(A) Healthy PPP clot, with small clot formation (arrow), with (B) no clot formed in the healthy PPP sample. (C,D) examples of clots from COVID-19 PPP samples and (E,F) healthy PPP clot with spike protein. Black arrow = small clot formed in control sample; red arrows large clots in COVID-19 sample.

