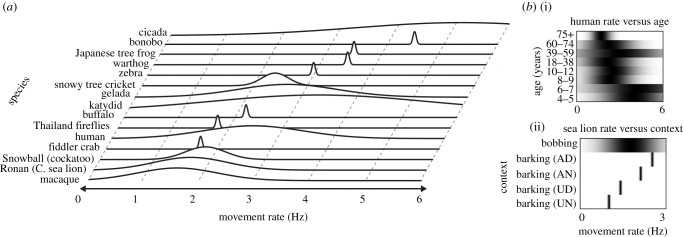
Figure 1.
(a) A framework for mapping and considering rhythmic abilities across species. Line plots show preferred rates and empirical ranges for synchronization across a sampling of species from table 1. Note: This figure is intended to be illustrative of how our proposed ecological approach could work, rather than being definitive regarding the relevant rates for a particular species. With more comprehensive data, further markers could be included to delineate relevant contextual factors. For visualization, data are modelled as Gaussian functions with full-width-half-maximum (FWHM) equal to the empirically documented synchronization range, when a range was available in the literature. When this was not the case, and only a single value was available, FWHM was set equal to a default minimum value of 0.05 Hz (fiddler crab, Thailand fireflies, buffalo, zebra, warthog, Japanese tree frog, bonobo). (b) Preferred rates and rate limits (flexibility) are context-dependent). (i) Human preferred rates slow over the lifespan, and the range of spontaneously produced rates is likewise not stable over age, becoming especially restricted over age 75; age-range data estimated from Alexander & Moore [38]. (ii) Sea lion vocalizations (barks) are produced at different rates depending on the medium (air versus water) and social context (directed versus undirected); AD = air directed, AN = air non-directed, UD = underwater directed, UN = underwater non-directed. Bark rates are plotted underneath the range of rates at which Ronan successfully synchronizes head bobs. In both panels, grayscale plots represent Gaussian functions, with dark colours corresponding to peaks.

