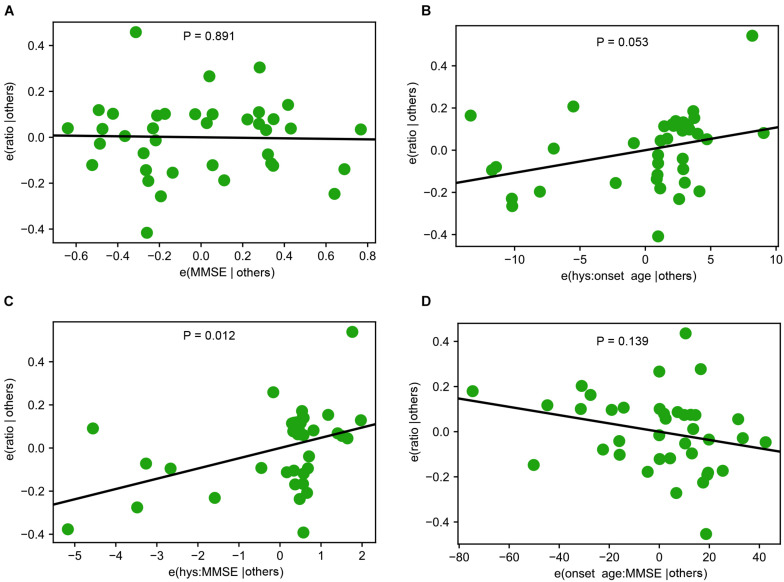
FIGURE 4.
Interactions among Demographic and Clinical Variables. (A) A representative partial regression plot shows the influence of a single variable, Mini-Mental Status Examination (MMSE), on Miro1 ratio. (B–D) Representative partial regression plots show the interactions of two variables for influencing Miro1 ratio. (B) Hoehn and Yahr Scale (hys) and onset age. (C) MMSE and hys. (D) Onset age and MMSE.

