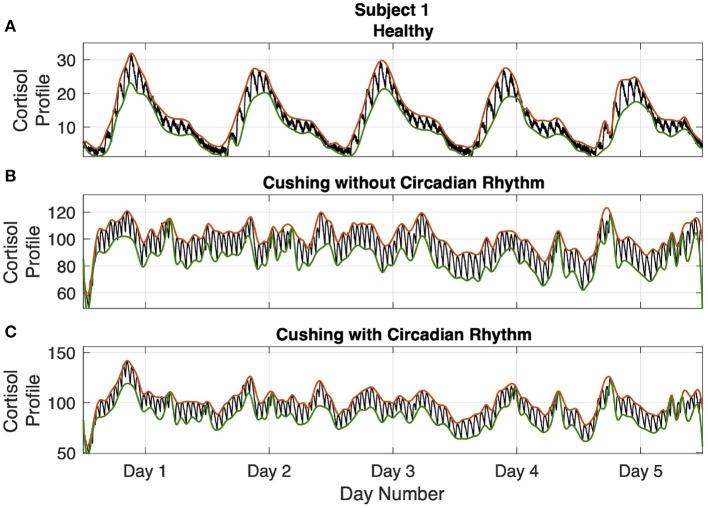
Figure 3.
Simulated multi-day cortisol profile - Subject 1. Panel (A) displays the healthy profile, panel (B) shows the profile associated with the Cushing's patients without circadian rhythm, and panel (C) depicts the profiles associated with the Cushing's patients with circadian rhythm. Each panel displays cortisol levels (black curve), upper bound envelopes (orange curve), and lower bound envelopes (green curve).

