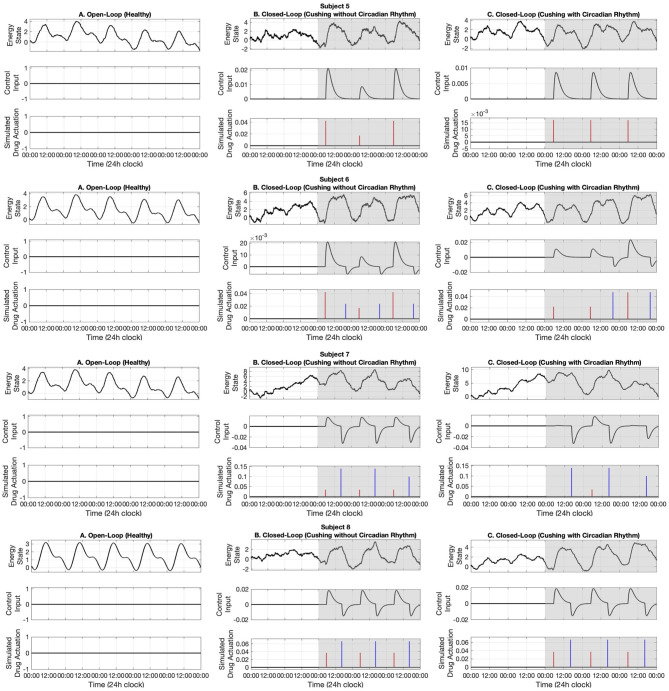
Figure 6.
Simulated energy regulation results (Subjects 5–8). For each subject, panel (A) displays the open-loop results. Panel (B) shows closed-loop results for the Cushing's patients without circadian rhythm, while panel (C) shows closed-loop results for the Cushing's patients with circadian rhythm. In each panel: the top sub-panel shows the estimated cognitive energy-related state, the middle sub-panel displays the control input, and the bottom sub-panel depicts the medication injections. Red pulses are related to excitation and the blue pulses are related to inhibition. The white background indicates open-loop simulation (i.e., u = 0), while the gray background depicts the closed-loop results.

