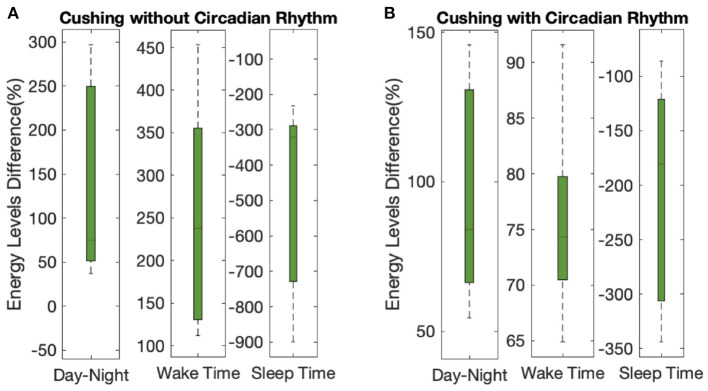
Figure 9.
Overall results analysis. The lower- and upper-bounds of the of each box represents the 25th and 75th percentiles of the distribution of each metric for all 10 subjects, and the middle line in each box displays the median. Panels (A,B) show the data corresponding to the Cushing patients without and with circadian rhythm in their cortisol profiles, respectively.

