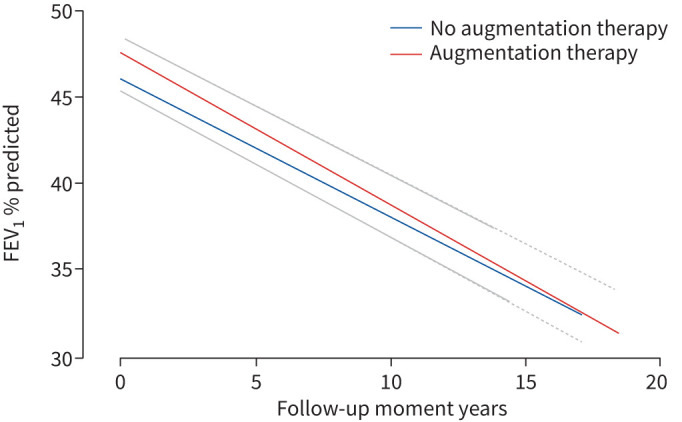
FIGURE 2.

Decline in forced expiratory volume in 1 s (FEV1) as % predicted over the years calculated by the mixed model without confounders, for both groups: untreated and treated. The confidence intervals of both graphs are overlapping, thereby only the upper confidence interval of the treated graph and the lower confidence interval of the untreated graph is shown. There was no significant difference in decline in FEV1.
