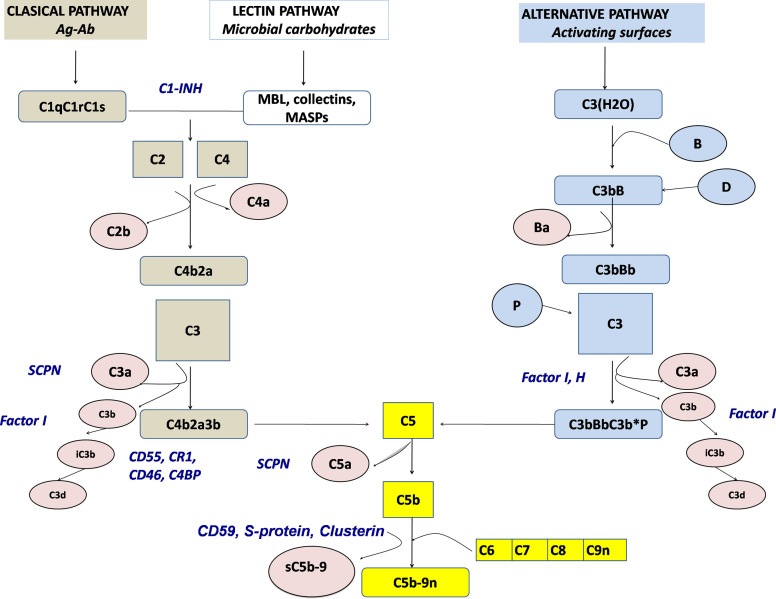
Figure 1.
Schematic representation of the complement activation pathways (brown: classical pathway, white: lectin pathway, light blue: alternative pathway, yellow: terminal pathway). Activation products, released into the fluid phase are presented in rose, whereas regulators are presented by blue. SCPN, serum carboxypeptidase N; MBL, mannose-binding lectin.

