
FIGURE 2.
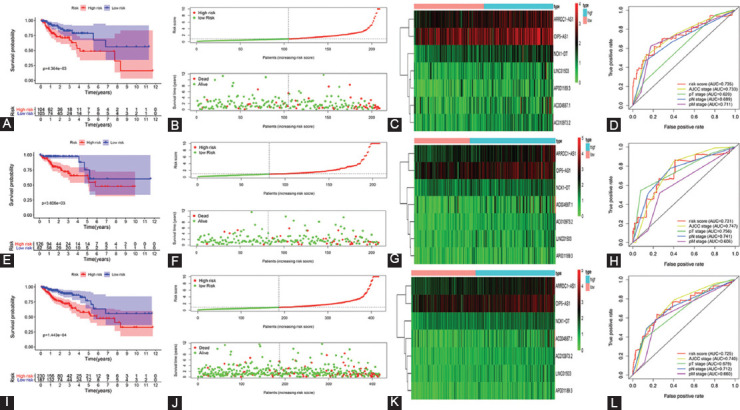
Validation of ferroptosis-related lncRNAs prognostic signature. (A) KM curve, (B) risk score, (C) heatmap, and (D) ROC curve of the prognostic signature in the training group. (E) KM curve, (F) risk score, (G) heatmap, and (H) ROC curve of the prognostic signature in the validation group. (I) KM curve, (J) risk score, (K) heatmap, and (L) ROC curve of the prognostic signature in the entire group.KM curve: Kaplan-Meier curve, ROC curve: receiver operating characteristics curve.